Friday, September 4, 2026
Home Blog Page 12

GBP/USD Gains Intraday Momentum and Retains Strong Support

GBP/USD News

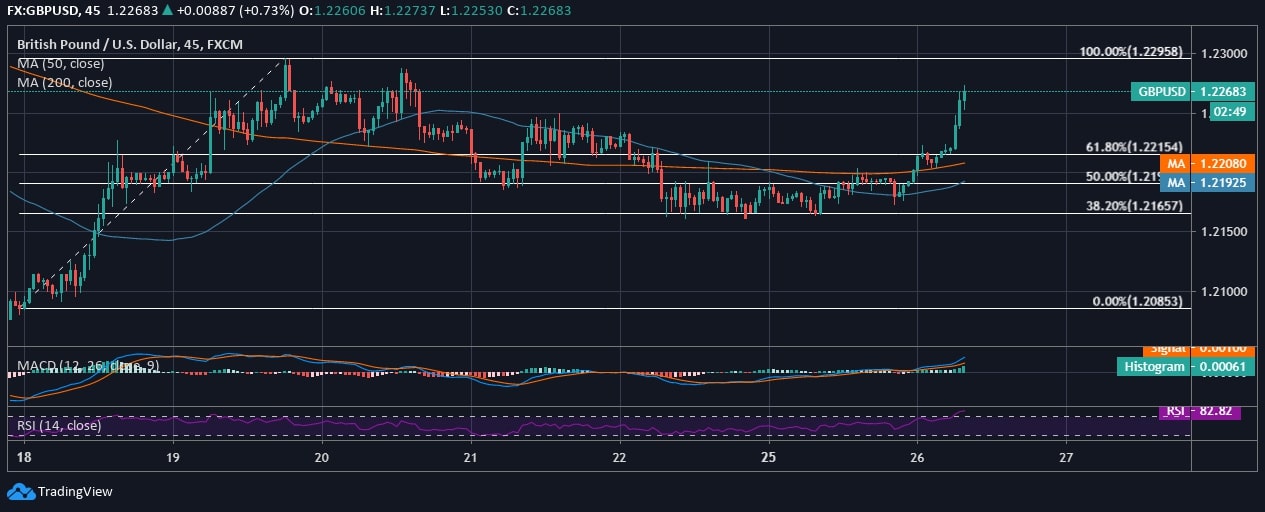
GBP/USD reverses the intraday trend and crosses above 61.80% Fib retracement level as the price spikes steeply, and the pair trades at 1.22683, at the press time. Pound, in the previous week, rose from the 7-day low price of 1.20853 and rose to a 7-day high price at 1.229. With an intermittent dip, the candlewick of the GBP/USD price trend slightly slid below 38.20% Fib Retracement level.
GBP/USD Price Chart

With a dull start to the week, yesterday, the price of Pound slid below 1.2165 against the US Dollar. As the pair gained the traction today, the price spiked from 1.220 and regained the lost 50-day and 200-day MA support on the intraday chart.

For the current trading price, the major support lies at 1.216, which is 38.20% Fib Retracement level, while on the other end, the price is already approaching the double top in a period of 7 days at 1.229, while currently, it is at 1.226. However, if the GBP/USD continues to keep strengthening during the trading session, today, it is likely to retest 7-day high. Additionally, as per the current economic crash, Pound is expected to face a tough resistance around 1.2300 to have a persistent trade above it.

The technicals appear bullish due to intraday gain of traction, and the MACD line crosses above the signal line, and the RSI lies at 82.82 and is hitting the overbought region.

New Zealand Dollar Draws a Winning Streak Yet Faces a Strong Resistance at 0.61

NZD/USD News

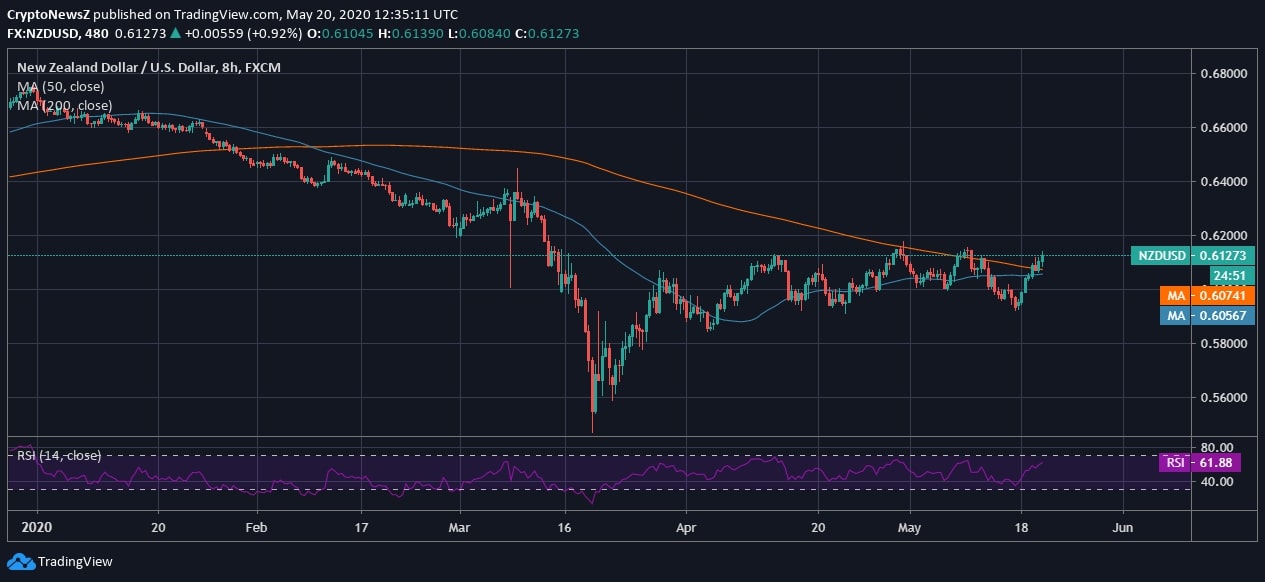
NZD/USD seems to be an intraday gainer and hits 0.61 after 9 days, and in between, it dipped as low as 0.592 on the 8-hourly chart. Just after spiking above 0.60, the pair regained the lost support from the daily moving averages. The pair are appearing quite volatile as if we look at the bigger picture; New Zealand Dollar has been trading in a narrow range of 0.58 to 0.61 since April, after the market crash in March.

NZD Price Chart

New Zealand Dollar has been gaining since the start of the week, and for the 3rd day straight, it is experiencing a bullish divergence against the US Dollar. However, the pair is facing a strict resistance at 0.61 in order to have a complete bullish crossover. The range-based trading is lacking momentum for a positive trade over the past 7 weeks now.

Here. NZD is seen strengthening against the USD, which helped the pair to have a winning streak in the early half of the week. The major support lies at 0.58, while the major and immediate resistance lies at 0.61 to have a near-term bullish crossover. The RSI of the NZD/USD is seen rising from the selling pressure after it gained for the 3rd day straight and lies at 61.88.

GBP/USD Hit 7-week Low and Falls Under Selling Pressure

GBP/USD News

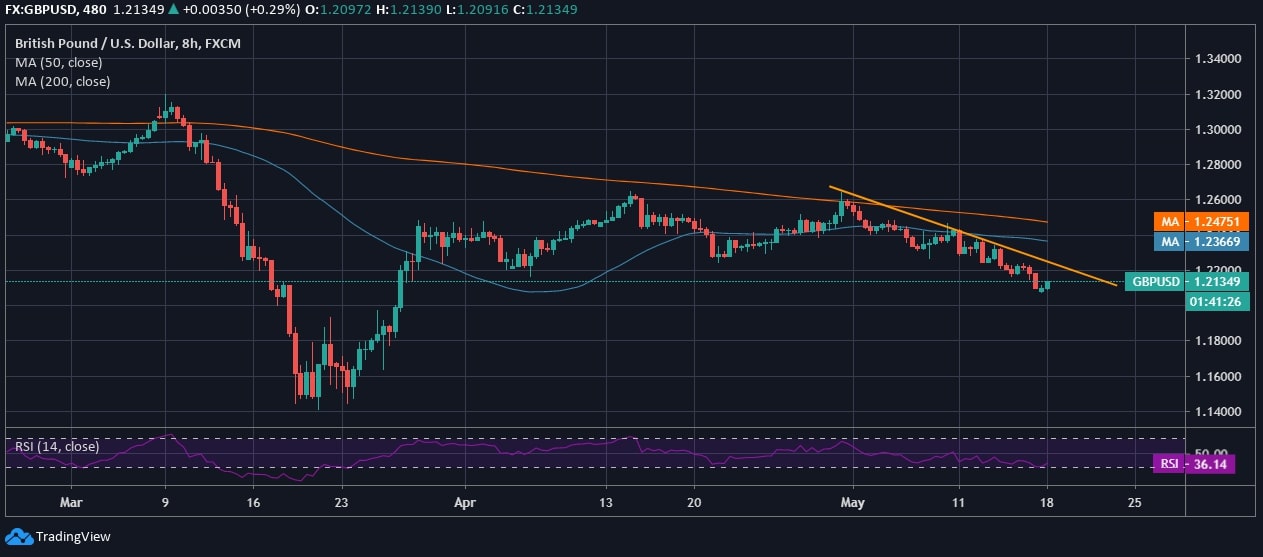
GBP/USD was seen accumulating until the onset of the ongoing month, and the pair is now experiencing a trend revision as it draws a fine downtrend. Moreover, after a steep fall in March, when Pound breached below 1.15 at 1.14 due to the worsening situation from the Coronavirus, which was then addressed as the Pandemic by WHO, the pair has failed to rise above 1.265 persistently. Therefore, it draws a major resistance, and as per the current momentum, it is facing intense selling pressure. Here, Pound is seen weakening in comparison to the US Dollar.

However, in the early trading sessions today, Pound had hit around 1.2125 for a brief period of time and at just at the onset and within no time retested intraday support at 1.204. Moreover, the GBP/USD fell to the lowest trading level and retested 7-week support, which was the last hit on March 26, 2020.

GBP/USD Price Chart

On the 8-hourly chart, Pound breaches the price accumulation and draws a descending trend due to a lack of traction. GBP/USD even fails to retain support from 50-day and 200-day daily MA after a slide below 1.24 price area. While the US Dollar was seen struggling in the previous week and hence a subdued demand of the US Dollar held support to EUR/USD.

Amidst the growing fear of the second wave of Pandemic, the economies have started to open up, and we believe that slowly yet not steadily, a rebound will help the currency to gain momentum towards the end of the month. However, the further dip will lead to retesting old support levels from March 2020 when the price of Pound hit the YTD lowest against the US Dollar.

EUR/USD Hits a Fresh 7-day Low Due to Lack of Intraday Traction

EUR/USD News

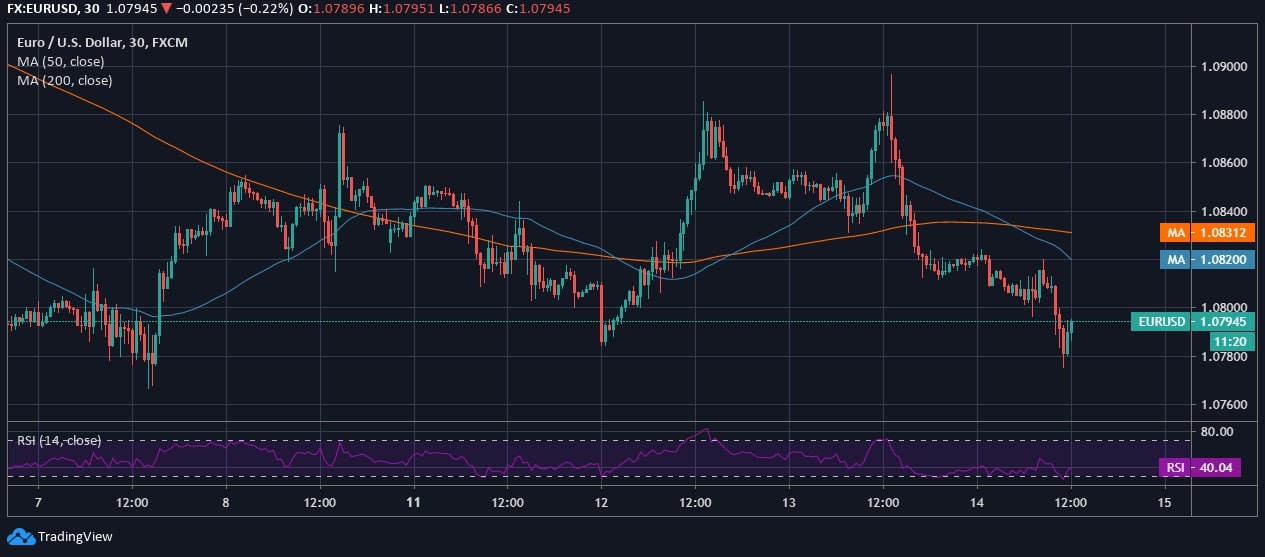
EUR/USD experiences a freefall in the intraday as it nosedives as low as 1.077 on the half-hourly chart. The pair is experiencing an intraday extremity after marking a 7-day high at 1.089 in yesterday’s trading session. However, Euro experienced a steep dip and closed the trading around 1.082.

The pair has lost steady support from the 50-day and 200-day MA after yesterday’s steep rejection and loss of traction in the intraday. With this, the technical indicator assigned has hit the selling zone and rose with a fine rebound, round the press time. If the price of Euro falls even further, we are likely to have a double bottom around 1.076 in the given 7-day duration.

EUR/USD price chart

On the half-hourly chart, the Euro is seen weakening against the greenback and has a notable loss of momentum. Towards the second half of the week, the pair is seen losing a substantial percent just like the previous week’s fall.

EUR/USD now holds major weekly support at 1.078 as the US Dollar strengthens against the Euro. Moreover, the main currency appears weaker because of the growing number of Coronavirus cases amidst the few relaxations given in the lockdown.

The major support to watch out for lies at 1.0780 and the major resistance lies at 1.082, which happens to be the current day’s low and yesterday’s closing price, respectively.

EUR/USD Gains Intraday Momentum & it Rises Above 1.08

EUR/USD Gains

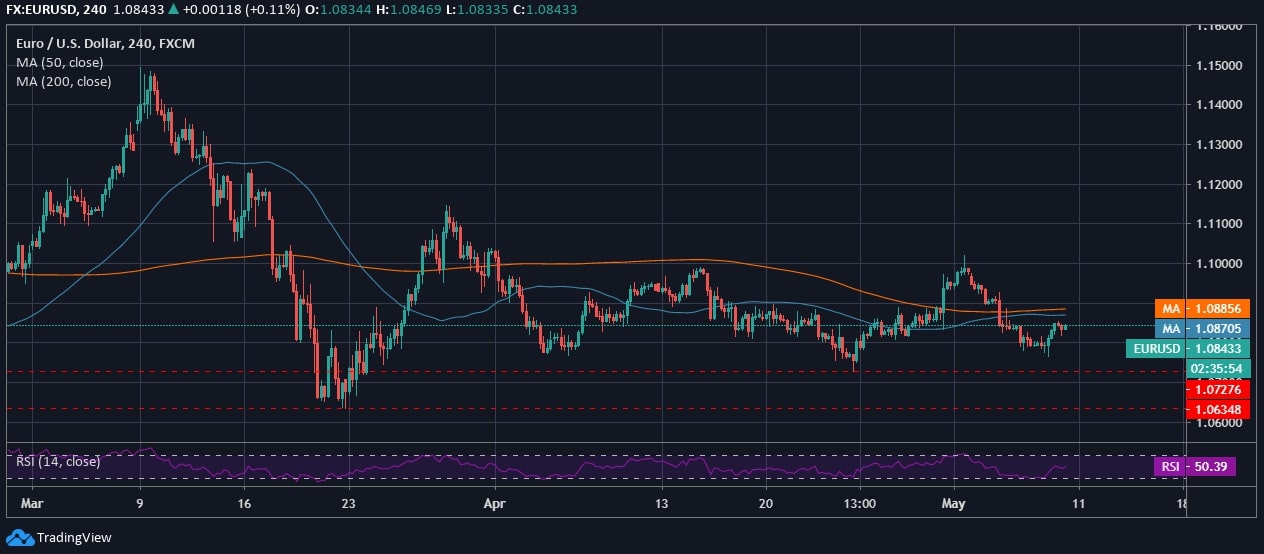
EUR/USD rebounded from an intraday low of 1.07 to trade at 1.084, at the press time. However, it fails to regain 50-day and 200-day MA support as the price still oscillates below 1.085 trading zone. On the lower end, the immediate and weekly support lies at 1.072, and the monthly support awaits at 1.063, which last happened during the global market crash in the month of March when the Coronavirus Outbreak was taking the toll across the globe.

EUR/USD Price Chart

On the 4-hourly chart, Euro is giving consecutive lower highs due to lack of traction and recently lost support in the intraday against the US Dollar. The near-term resistance lies at 1.09, which can much of an intraday target if the pair continues with the gaining momentum and draws a winning streak as compared to the previous week’s trend.

With the relaxation given amidst the lockdown due to the Pandemic, US Dollar is gaining its charm back, yet the economy is still away from even a moderate recovery. The technicals draw an intraday relief as the RSI rise from the selling zone and are currently at 50.39.

USD/JPY Draws an Intraday Bullish Streak at 106.5

USD/JPY Draws

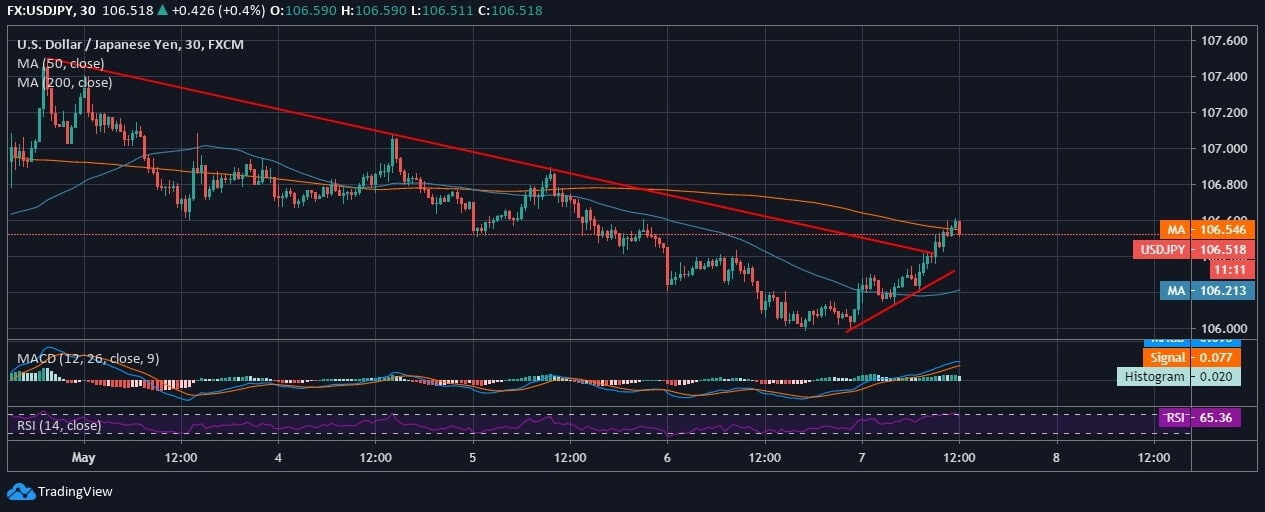
USD/JPY exhibits an amazing intraday rebound from 106 to 106.5 in the given trading duration from the onset of the day until the press time. After a notable decline over the past six days, USD/JPY seems to have an amazing intraday momentum in the global market. After the mid-day of the trading session, USD/JPY spiked from the weekly lows and exhibited a clear rebound.

Technical Analysis: USD/JPY

USD/JPY Technical Analysis

After a brief short-coming below 106, USD/JPY closed with a gaining rebound on Wednesday, and after a slight bullish candlestick aversion, the trend rose steeply today. The bullish trigger is likely to face resistance at 106.8, and the return of US Dollar as the reserve currency as the officials extend lockdown with relaxations for the economy to start, will boost the pair and its demand.

As of now, the technicals are drawing a bullish picture as the MACD crosses above the signal line due to intraday rebound in the price of USD/JPY. The RSI is also nearing the overbought region as the demand increased and lies at 65.36. However, once the pair makes a complete rebound, it will retain support from 200-day MA while holds 50-day daily MA support at 106.2.

USD/CAD Trades Around 1.405 as it Rejects 1.41 Price Area

USD/CAD Trades

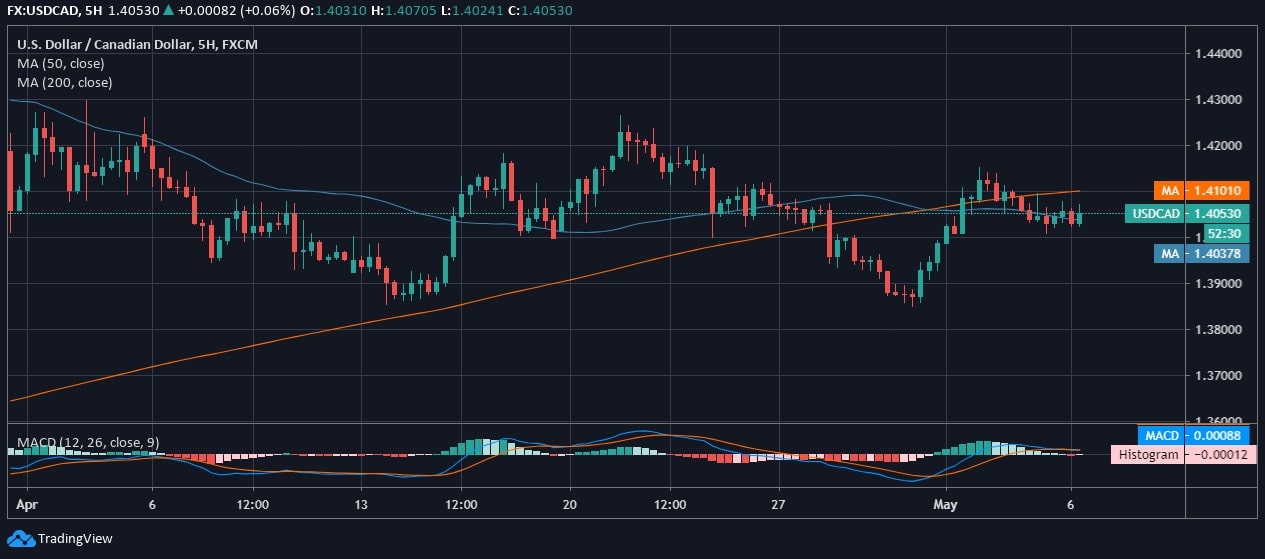
USD/CAD faced a clear rejection above 1.41 and is on a downtrend after attempting a rebound above 1.38 to 1.41, while currently trades around 1.40 in the global market. The intraday is exhibiting a dull trail of the pair around 1.40 in today’s trading session, i.e., on May 6, 2020. However, the pair is trading around the critical support area on the 5-hourly chart while it retains 50-day MA support losing 200-day MA support as it plummeted below 1.41.

USD/CAD Analysis

USD/CAD Analysis

The pair closed around 1.4075 and 1.4080 in yesterday’s trading session, and at the time of writing, it stabilized itself at 1.405 support, holding 1.40 as the psychological support. Moreover, the price of USD/CAD is showing a certain kind of trend as it draws 2 notable downtrends in the previous month and appears to be drawing one now. However, if the pair follows the trend, it is likely to retest support at 1.39 before the weekend. Despite a few relaxations given, the US Dollar has not yet recovered, with its total capacity managed to retain the status of standard currency.

Currently, the pair is yet to fall under utter selling pressure as the oil prices—interconnected commodity is striking the buyer’s interest as it rebounds intermittently. The MACD appears like it is losing the gains as the signal line appears crossing the MACD line.

EUR/USD Draws a Bearish Crossover Below 1.090

EUR/USD Draws a Bearish

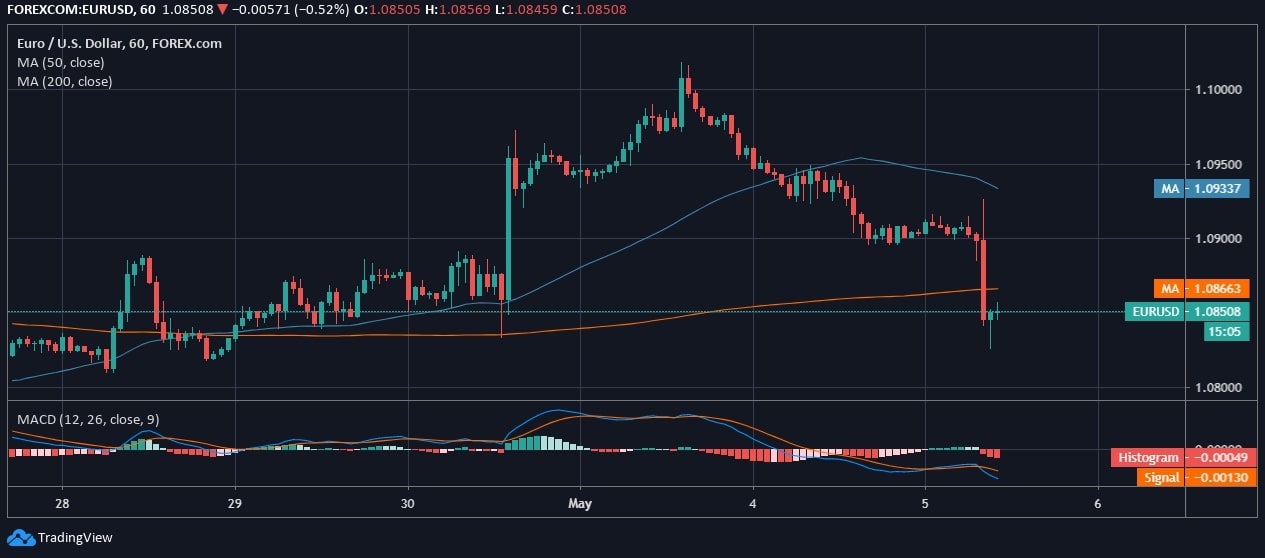
EUR/USD draws a bearish candlestick below 1.09 at 1.082 and marks the lowest of the day, until the time of writing. With a bearish candlestick drawing around the lowest of the day, Euro became the prey of selling pressure and is rejecting a bullish move above 1.10, since the previous week. Moreover, the recent intraday fall failed to retain the moving average’s support due to a bearish crossover.

EUR/USD Analysis

EUR/USD Analysis

On the hourly chart, Euro is facing a complete rejection above 1.10 since the onset of the month, even after managing a steep rise above 1.0950 on the last trading day of the previous month. The pair lost imminent support from 50-day MA as the price plummeted below 1.094 on the hourly chart, and with intraday loss of momentum, the 200-day MA support went afloat around 1.0866. The technicals are confirming the bearish consolidation as the signal line crosses above the MACD line after the steep bullish candle aversion and continuous downtrend for the past 5 days.

The major support to watch out for lies at 1.080 and 1.075 against the greenback, while the immediate daily resistance stands at 1.100.

GBP/USD Experiences a Dull Day as It Extends Its Previous Week’s Fall

GBP_USD Fails to Retain Steady

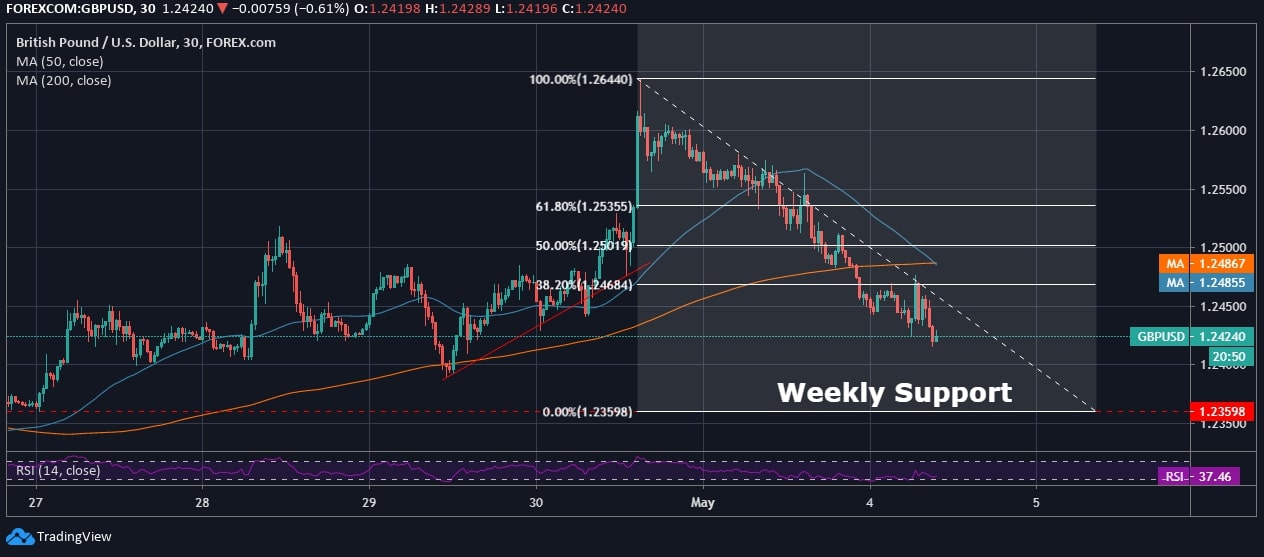
GBP/USD dips around the 5-day low price at 1.242 with a bearish daily enclosure over the past four days. As per the current momentum, the current trading session is going to bring no good either. The current descending channel has left Pound with no support from 50-day and 200-day MA on the half-hourly chart. The trend of the pair is already below 38.20% Fib Retracement level after the price descended below 1.246.

Technical Analysis: GBP/USD

GBP Price Chart

On the half-hourly chart, the fine uptrend in the early half of the previous week was breached due to a steep rise around the 2-week resistance at 1.264. the pair is facing a strong hit at 1.264 due to lack of steady traction, while currently remains dull in the trading session. As Pound fails to rise against the greenback due to the economic standstill with the Coronavirus outbreak, the pair is likely to have an extended fall due to a lack of steady support. This will rightly confirm the bearish consolidation around 0.00% Fib Retracement level at 1.235 price area.

The technicals are drawing a bearish picture as the US Dollar is unable to revive due to the economic setback; however, a few relaxations are likely to be helpful. The RSI of the GBP/USD is hitting at 37.46, and a further dip will lead to increased selling pressure.

TRON Users Exclusively Eligible for Monthly JUST Giveaway for Next Two and Half Years

JUST Foundation Will Airdrop JST Tokens Every Month for Users

TRON users will be the only ones to be eligible for the monthly airdrop promised for the next two and a half years by JUST Foundation. Justin Sun, CEO of Tron Foundation, posted a thread on Twitter informing about the details of the airdrop, which will begin from May 20. The first airdrop will correspond to 2.2% of the total supply.

As per a Medium post shared by TRON, JUST Foundation will airdrop 237,600,000 JST tokens over the next 12 months from the initial giveaway. It was further stated in the post,

JUST (JST) will be airdropped to all the addresses running on TRON’s blockchain that have a TRX balance greater than or equal to 100 TRX. Due to the large amount to be distributed, receiving the tokens may take up to 72H and you may want to connect with the customer support service of the exchanges & wallets supporting our airdrop program where your TRX are stored if you have any questions.

In a tweet from the thread, Justin said that JUST will airdrop 257,400,000 JST from June 2021 to May 2022, and 277,200,000 JST between June 2022 and October 2022. JUST Foundation is also the governing body of the USDJ Stablecoin, which is backed by the US Dollar.