GBP/USD dips around the 5-day low price at 1.242 with a bearish daily enclosure over the past four days. As per the current momentum, the current trading session is going to bring no good either. The current descending channel has left Pound with no support from 50-day and 200-day MA on the half-hourly chart. The trend of the pair is already below 38.20% Fib Retracement level after the price descended below 1.246.
Technical Analysis: GBP/USD
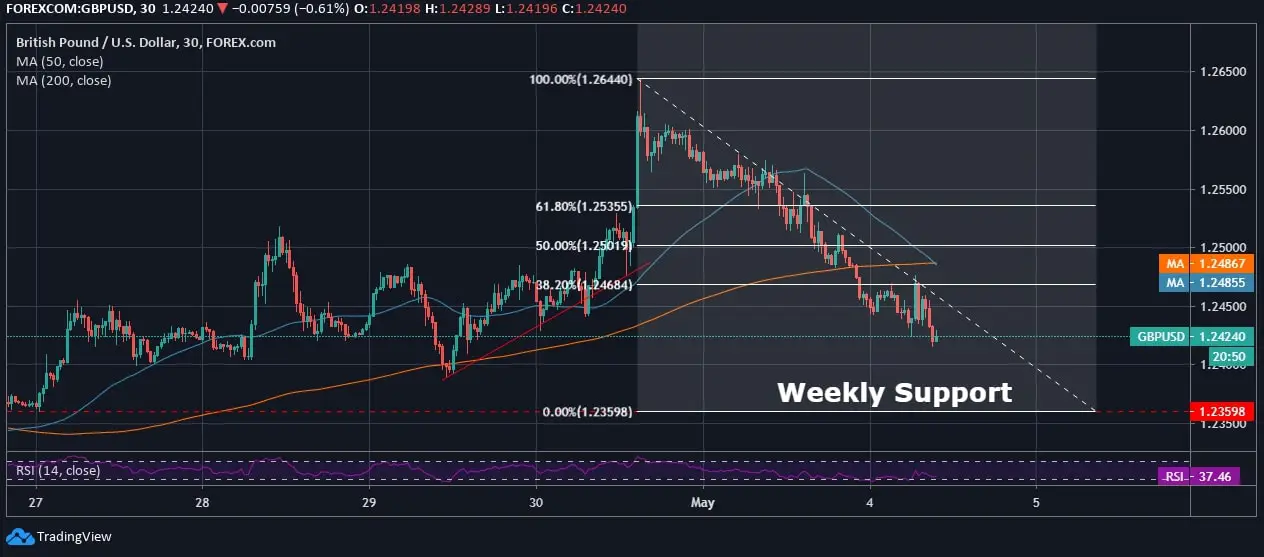
On the half-hourly chart, the fine uptrend in the early half of the previous week was breached due to a steep rise around the 2-week resistance at 1.264. the pair is facing a strong hit at 1.264 due to lack of steady traction, while currently remains dull in the trading session. As Pound fails to rise against the greenback due to the economic standstill with the Coronavirus outbreak, the pair is likely to have an extended fall due to a lack of steady support. This will rightly confirm the bearish consolidation around 0.00% Fib Retracement level at 1.235 price area.
The technicals are drawing a bearish picture as the US Dollar is unable to revive due to the economic setback; however, a few relaxations are likely to be helpful. The RSI of the GBP/USD is hitting at 37.46, and a further dip will lead to increased selling pressure.