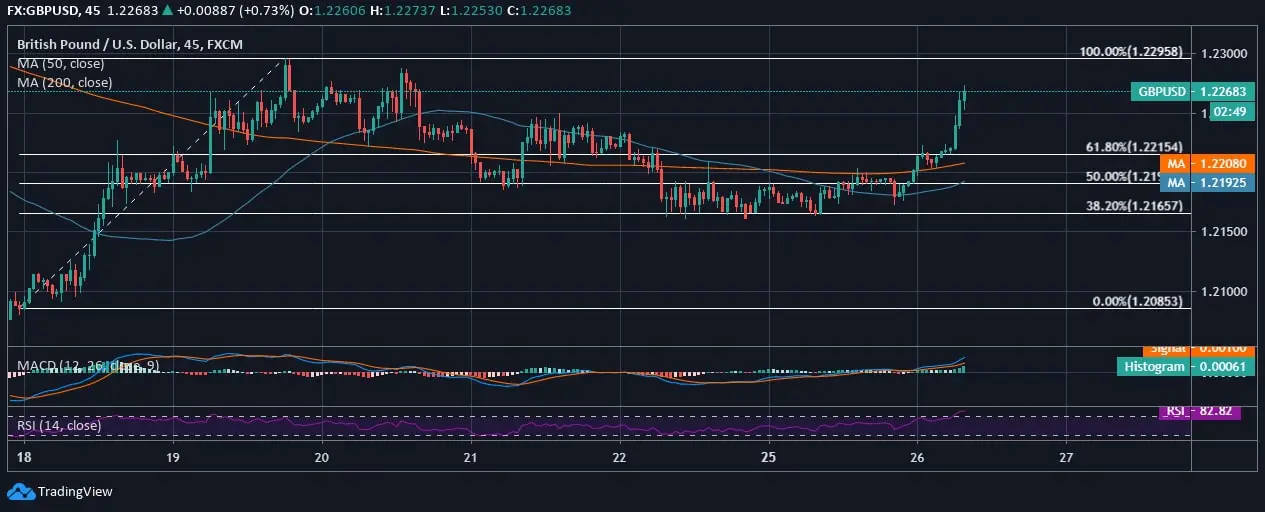
GBP/USD reverses the intraday trend and crosses above 61.80% Fib retracement level as the price spikes steeply, and the pair trades at 1.22683, at the press time. Pound, in the previous week, rose from the 7-day low price of 1.20853 and rose to a 7-day high price at 1.229. With an intermittent dip, the candlewick of the GBP/USD price trend slightly slid below 38.20% Fib Retracement level.
With a dull start to the week, yesterday, the price of Pound slid below 1.2165 against the US Dollar. As the pair gained the traction today, the price spiked from 1.220 and regained the lost 50-day and 200-day MA support on the intraday chart.
For the current trading price, the major support lies at 1.216, which is 38.20% Fib Retracement level, while on the other end, the price is already approaching the double top in a period of 7 days at 1.229, while currently, it is at 1.226. However, if the GBP/USD continues to keep strengthening during the trading session, today, it is likely to retest 7-day high. Additionally, as per the current economic crash, Pound is expected to face a tough resistance around 1.2300 to have a persistent trade above it.
The technicals appear bullish due to intraday gain of traction, and the MACD line crosses above the signal line, and the RSI lies at 82.82 and is hitting the overbought region.
