NZD/USD seems to be an intraday gainer and hits 0.61 after 9 days, and in between, it dipped as low as 0.592 on the 8-hourly chart. Just after spiking above 0.60, the pair regained the lost support from the daily moving averages. The pair are appearing quite volatile as if we look at the bigger picture; New Zealand Dollar has been trading in a narrow range of 0.58 to 0.61 since April, after the market crash in March.
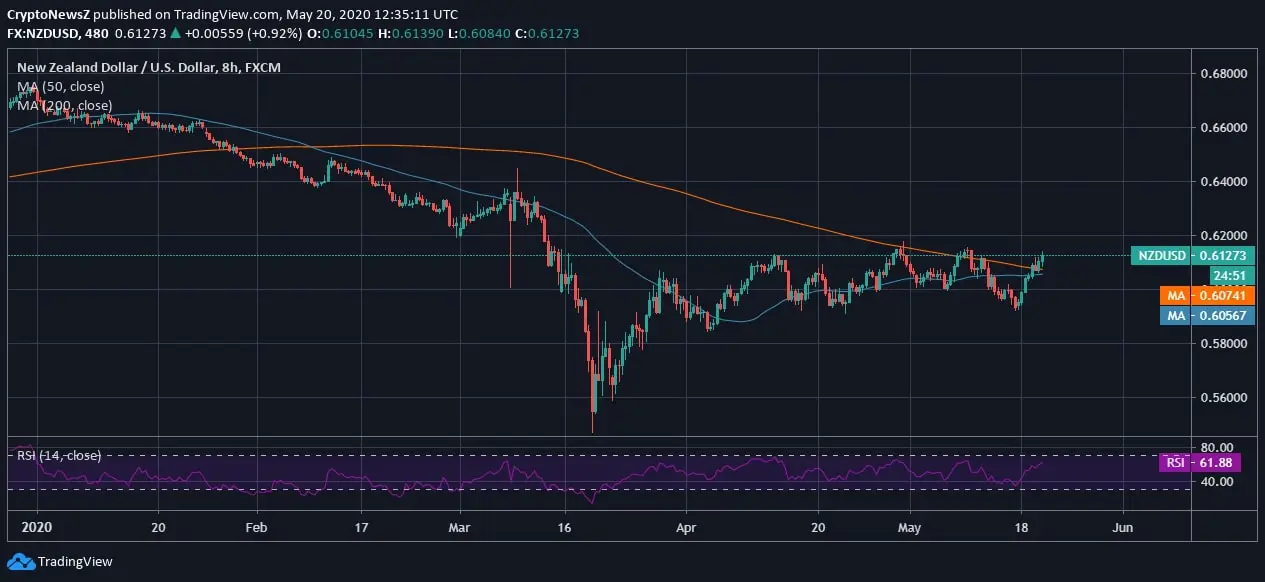
New Zealand Dollar has been gaining since the start of the week, and for the 3rd day straight, it is experiencing a bullish divergence against the US Dollar. However, the pair is facing a strict resistance at 0.61 in order to have a complete bullish crossover. The range-based trading is lacking momentum for a positive trade over the past 7 weeks now.
Here. NZD is seen strengthening against the USD, which helped the pair to have a winning streak in the early half of the week. The major support lies at 0.58, while the major and immediate resistance lies at 0.61 to have a near-term bullish crossover. The RSI of the NZD/USD is seen rising from the selling pressure after it gained for the 3rd day straight and lies at 61.88.