Tuesday, September 16, 2025
Home Blog

WFE Calls for Tokenized Stock Regulation Amid Boom

WFE Calls for Tokenized Stock Regulation Amid Boom

Key Highlights

  • The value of tokenized  stocks has surged rapidly, with their market capitalization exceeding $370 million 
  • The movement is being driven by major traditional finance firms like BlackRock, Fidelity, and Goldman Sachs
  • Major retail trading and crypto platforms such as Robinhood, Kraken, and Coinbase are racing to offer tokenized  stocks

The World Federation of Exchanges (WFE) has issued a formal call for regulatory action against the proliferation of ‘tokenized  stocks.’ 

This influential body, which represents over 250 exchanges and clearinghouses globally, contends that these blockchain-based instruments pose a substantial threat to investor protection and the fundamental integrity of established markets, according to the latest report.

“We are alarmed at the plethora of brokers and crypto-trading platforms offering or intending to offer so-called tokenized  U.S. stocks. These products are marketed as stock tokens or the equivalent to stocks when they are not,”  the WFE stated in a letter.

The move comes amid a growing institutional pushback against the rapid innovation occurring within the crypto sector, setting the stage for a pivotal regulatory clash.

What are tokenized  Stocks?

Tokenized equities are digital tokens, built on blockchain technology, that are designed to track the price of a publicly traded company’s shares. 

Crucially, however, purchasing these tokens does not confer actual ownership in the underlying corporation. Investors are not registered shareholders and thus lack critical rights, such as voting privileges or entitlement to dividends. 

WFE Raises Concern over Tokenized Stocks

Despite this fundamental difference, the WFE alleges that these products are frequently marketed to retail investors in a manner that misleadingly suggests equivalence to traditional stock ownership, creating a potentially dangerous misconception.

The WFE’s concerns, detailed in a letter to major international regulatory bodies, extend beyond investor confusion. The federation warns of a tangible risk to the reputational standing of the actual companies whose stocks are being mimicked. 

This argument is likely to resonate powerfully with regulators and publicly-listed firms alike, framing the issue as one of market-wide stability rather than mere technical compliance.

With prominent platforms like Robinhood and Coinbase advancing into this nascent space, the pressure on regulators to provide clear and enforceable guidelines is intensifying. 

The WFE’s position is unequivocal, which is that securities laws must be rigorously applied to these novel assets, legal frameworks for custody must be clarified, and marketing practices must be strictly policed to prevent misleading comparisons. 

The response from regulators will now be closely watched, as it will determine whether tokenized stocks can be integrated into the mainstream financial system or relegated to its periphery.

Earlier, the Securities Industry and Financial Markets Association (SIFMA) had asked the U.S. Securities and Exchange Commission (SEC) to reject requests from cryptocurrency companies seeking special permission to offer tokenized stocks. 

“SIFMA members have been reading with significant concern recent reports indicating that certain digital asset firms have submitted requests for immediate no-action or exemptive relief from requirements under the federal securities laws to allow such firms to offer investors the ability to purchase and trade tokenized equities or other digital forms of traditional securities through the firms’ platforms,” stated in an open letter. 

Boom in Tokenized  Stocks

Imagine a digital version of a company’s stock, like Apple or Tesla, but one that you can buy and sell online just like a cryptocurrency. These are called tokenized stocks. They’re built on blockchain technology, which allows for trading at any time of day, buying tiny fractions of a share, lower costs, and opening up access to investors all over the globe, often without the need for a traditional bank or broker.

The growth of these tokenized stocks in 2025 has been explosive. By the middle of the year, their total market value skyrocketed past $370 million after a huge 220% surge in their worth, creating a wave of excitement similar to the early days of decentralized finance. The amount of money being traded on certain platforms shot up from $15 million to a massive $100 million every single month.

This boom is being led by some of the biggest names in finance. Giant firms like BlackRock, Fidelity, and Goldman Sachs have started offering these products, helping to push the total value of tokenized company shares to over $50 billion. 

Companies are eager to get involved because turning stocks into tokens creates new opportunities and makes markets run more smoothly.

Popular trading apps are joining in, too. Robinhood, for instance, made over 200 tokenized stocks available for its users in Europe, even including shares from private companies like OpenAI. This move was so popular it helped drive Robinhood’s own stock price to an all-time high. Other major crypto exchanges are also racing to launch their own approved versions.

Bitcoin Calm Before the Storm? Active Supply Dip Leaves Room for Breakout

Bitcoin Soars Above $119,000 after Dipping Below $113,00
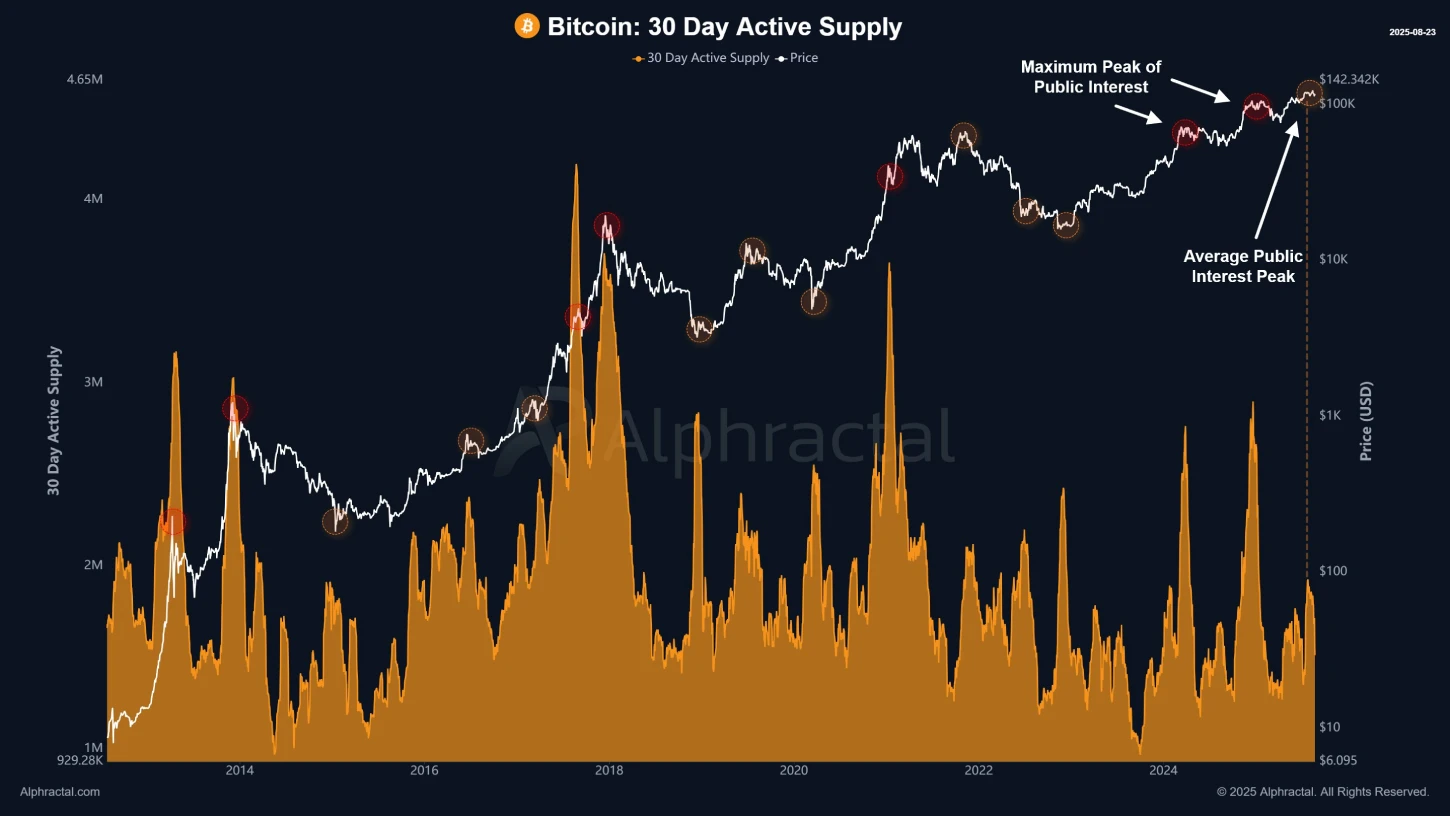
  • Bitcoin’s 30-day active supply in decline shows a slowdown in market activity to build the next major move.
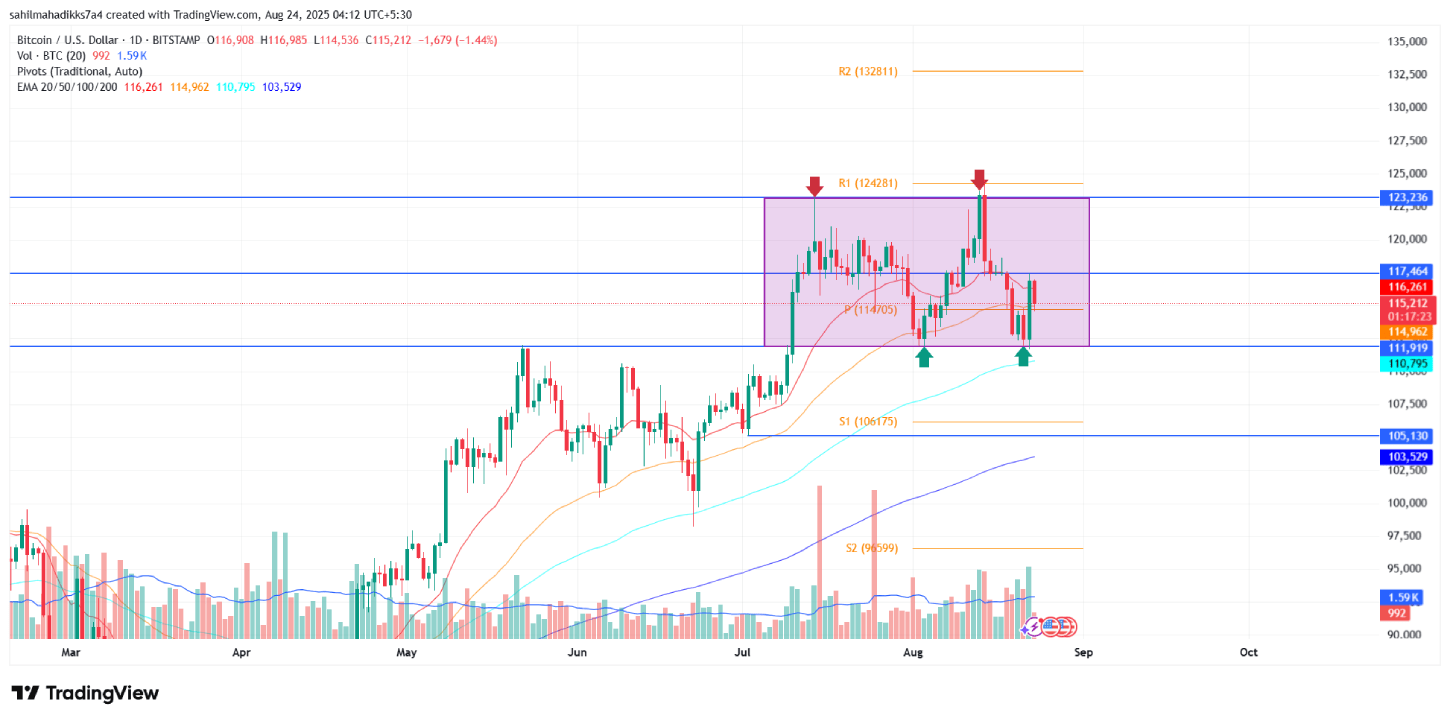
  • The Bitcoin price drives a short consolidation trend between the $123,236 and $111,999 horizontal levels.
  • BTC’s fear and greed index dropped to 60%, indicating a greed sentiment among market participants for higher recovery.

The renewed recovery in Bitcoin price took a short pullback on Saturday, August 23rd, where it dropped over 1.5% to trade at $115,273. However, this selling pressure backed by weak volume indicates a lack of conviction from sellers and higher potential for bullish continuation. The recent slowdown in BTC’s supply movement further accentuates that the market is shaping up for the next big move. Will the top cryptocurrency climb towards $130,000, or is a major correction looming?

Supply Movement Cools Off as Bitcoin Prepares for Next Major Move

Last Friday, the Bitcoin price showcased a sharp rebound from $111,919 weekly support with nearly a 4% gain. A primary catalyst behind this jump was Federal Reserve Chair Jerome Powell’s remarks at Jackson Hole, where he hinted at potential interest rate cuts amid shifting economic risks.

Despite Powell’s cautious tone, the market optimism bolstered a majority of major cryptocurrencies for a sharp rebound. However, the recovery took a slowdown on Saturday, and BTC plunged to $115,273 with a 20% fall in trading volume. The lower volume during the pullback suggests reduced selling pressure, leaving room for a potential recovery if buyer participation strengthens.

Low volume often allows buyers to build bullish momentum for the next leap. The latest on-chain data on Bitcoin’s 30-day active supply supports this bullish narrative. This metric tracks the number of unique coins moved in the past month, acting as a thermometer of market interest in BTC.

A rising trend in this metric suggests fresh capital inflow and stronger investor activity. Historically, these spikes have aligned with market tops and bottoms, as greed or fear often drives investors to move coins rapidly. 

Bitcoin 30-Day Active Supply | Alphractal

On the other hand, a declining trend in BTC’s 30-day active supply shows a quieter phase, with fewer coins in motion. Such a cooldown typically follows periods of extreme activity.

At present, Bitcoin’s supply movement has slowed down, suggesting a clearer backdrop after a recent surge in market enthusiasm. This moderation could provide the Bitcoin price a short breather to build its momentum for its next major move.

Bitcoin Price Enters Post-Rally Consolidation

The short-term trend analysis of the Bitcoin price shows a sideways shift to its prevailing recovery phase. Over the past six weeks, the coin price has reversed twice from the overhead resistance of $123,236 and bounced twice from the newfound support of $111,999, indicating a consolidation trend in action.

Following the July rally, this lateral trend could allow buyers to recuperate the exhausted bullish momentum before the next breakout. The coin price trading above the daily exponential moving average (20, 50, 100, and 200) accentuates the broader market sentiment.

Currently, the coin buyers are struggling to breach the midline resistance of this consolidation trend at $117,838. If the buyers flip this resistance to support, an accelerated bullish momentum could push BTC price against all-time high resistance at $123,236.

A potential breakout with a daily candle closing will signal the continuation of the prevailing uptrend, with the traditional pivot level indicating the next key resistance at $138,820.

Bitcoin Price
BTC/USDT -1d Chart

On the contrary, if the sellers force a breakdown below the $111,900 support, the coin price could enter a deeper correction towards the $105,357 mark.

Also Read: Grayscale Files for XRP ETF, Soars 7% in a Day

Grayscale Files for XRP ETF, Soars 7% in a Day

Grayscale Files for XRP ETF, Soars 7% in a Day

Key Highlights

  • Grayscale submits S-1 for spot XRP ETF
  • This filing comes after landmark legal clarity on XRP status
  • Joins wave of filings for institutional access

On August 22, Grayscale Investments, an entity whose name carries considerable weight in the corridors of both Wall Street and the cryptocurrency world, formally initiated the process with the U.S. Securities and Exchange Commission (SEC) to launch a spot exchange-traded fund for the digital asset XRP. 

Grayscale XRP ETFs(Source: Watcher.Guru on X)

The filing shows a potential paradigm shift, which offers a bridge for traditional capital to access the efficiencies of decentralized payment networks through a familiar and structured vehicle.

Grayscale XRP ETF Filing

The proposed fund’s architecture is critical to understanding its implications. As a spot ETF, the product would be directly backed by physical reserves of XRP, held in secure, institutional-grade custody.

This structure is important as it provides investors with pure exposure to the asset’s market performance, untethered from the complexities and potential contango associated with futures-based derivatives. 

For the institutional investor, this means a streamlined, compliant pathway to gain exposure to an asset class previously mired in operational complexity. 

It demystifies the process, transforming a digital token into a tradable security on a major national exchange, complete with the expected regulatory oversight and reporting transparency.

This ambitious proposal does not emerge from a vacuum. Its very possibility is predicated upon a hard-fought legal and regulatory clarification. 

This filing comes amid upward momentum in XRP tokens as it soared over 7% in a day. At the time of writing, the token is trading at around $3.06, according to CoinMarketCap.

The shadow that once loomed over XRP, cast by the Securities and Exchange Commission’s lawsuit against Ripple Labs Inc., has largely receded following a series of pivotal judicial rulings. 

A federal judge’s determination that XRP is not in itself a security when traded on secondary exchanges effectively dismantled the primary barrier to its consideration for such a product. 

This legal precedent, now solidified, has recontextualized XRP within the regulatory framework, aligning it more closely with commodities like bitcoin and ether, which have already secured this coveted ETF status. The filing is, in many ways, the first major fruit of that legal labor.

Grayscale’s entry into this arena adds a potent catalyst to an already active field. They are not a lone voice but rather a powerful participant in a growing chorus of asset managers, including firms like Bitwise and Franklin Templeton, who have submitted similar applicatio

The near-synchronized timing of amended S-1 filings from several issuers suggests a coordinated push, often interpreted by market analysts as a sign of ongoing, productive dialogue with regulators. 

The SEC’s deliberate pace in reviewing these applications, extending its deliberation period rather than issuing dismissals, is itself viewed by many seasoned observers as a cautiously optimistic indicator. 

The involvement of an established player like Grayscale, with its successful history of converting a trust into a spot bitcoin ETF, lends considerable credibility and momentum to the entire endeavor.

The ramifications of a successful launch extend far beyond mere price speculation. Approval would represent a seminal moment of validation for the underlying utility of the XRP Ledger, which is engineered for the rapid, low-cost settlement of cross-border payments. 

It would grant pension funds, endowments, and retail investors alike the ability to gain exposure to the growth of this blockchain-based financial infrastructure through their existing brokerage accounts. 

This legitimization has the potential to accelerate adoption among financial institutions, enhance overall market liquidity, and further cement digital assets as a permanent and innovative component of the global financial system. 

The Grayscale filing is more than a proposal; it is a bellwether for the industry’s continued march toward integration and acceptance.

Uniswap Price Eyes $10 Breakdown as Long-Term Holders Sell Into Strength

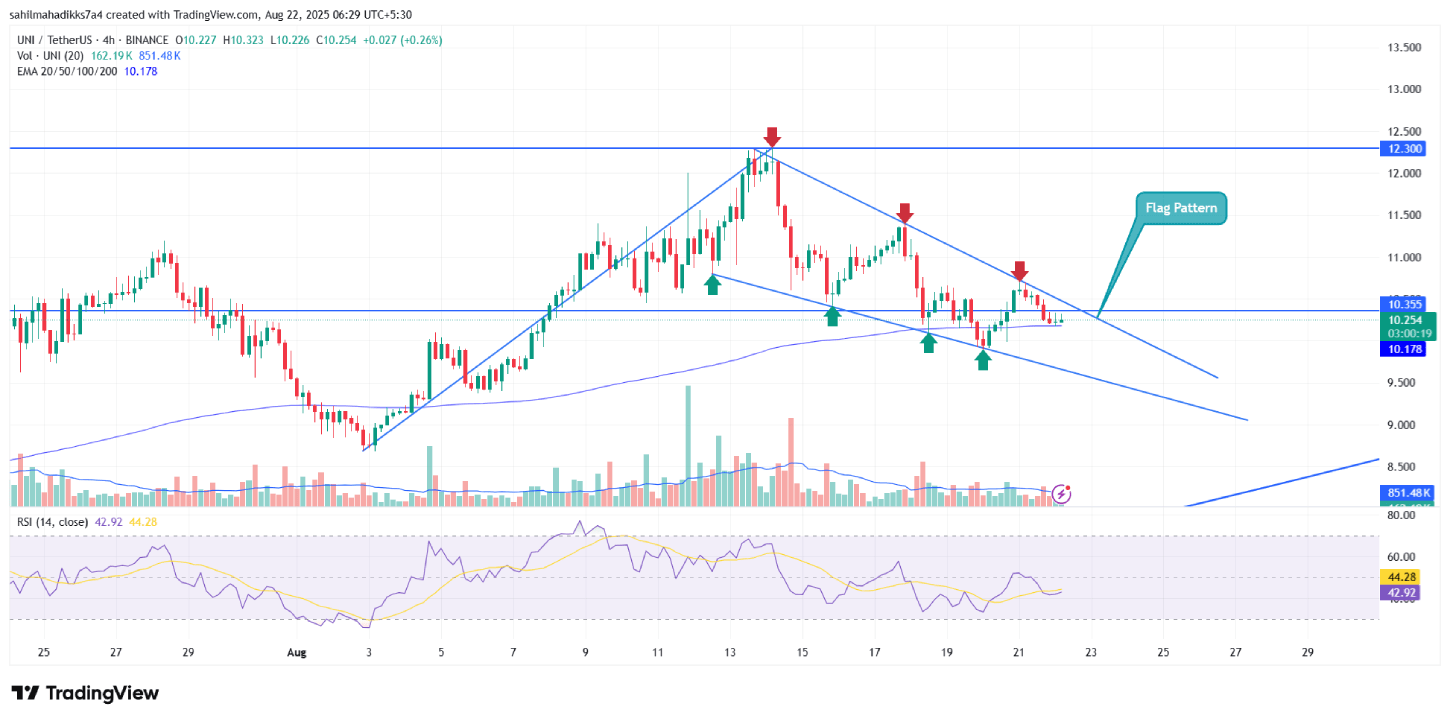
  • The formation of a bull flag pattern drives the current correction trend in Uniswap price.
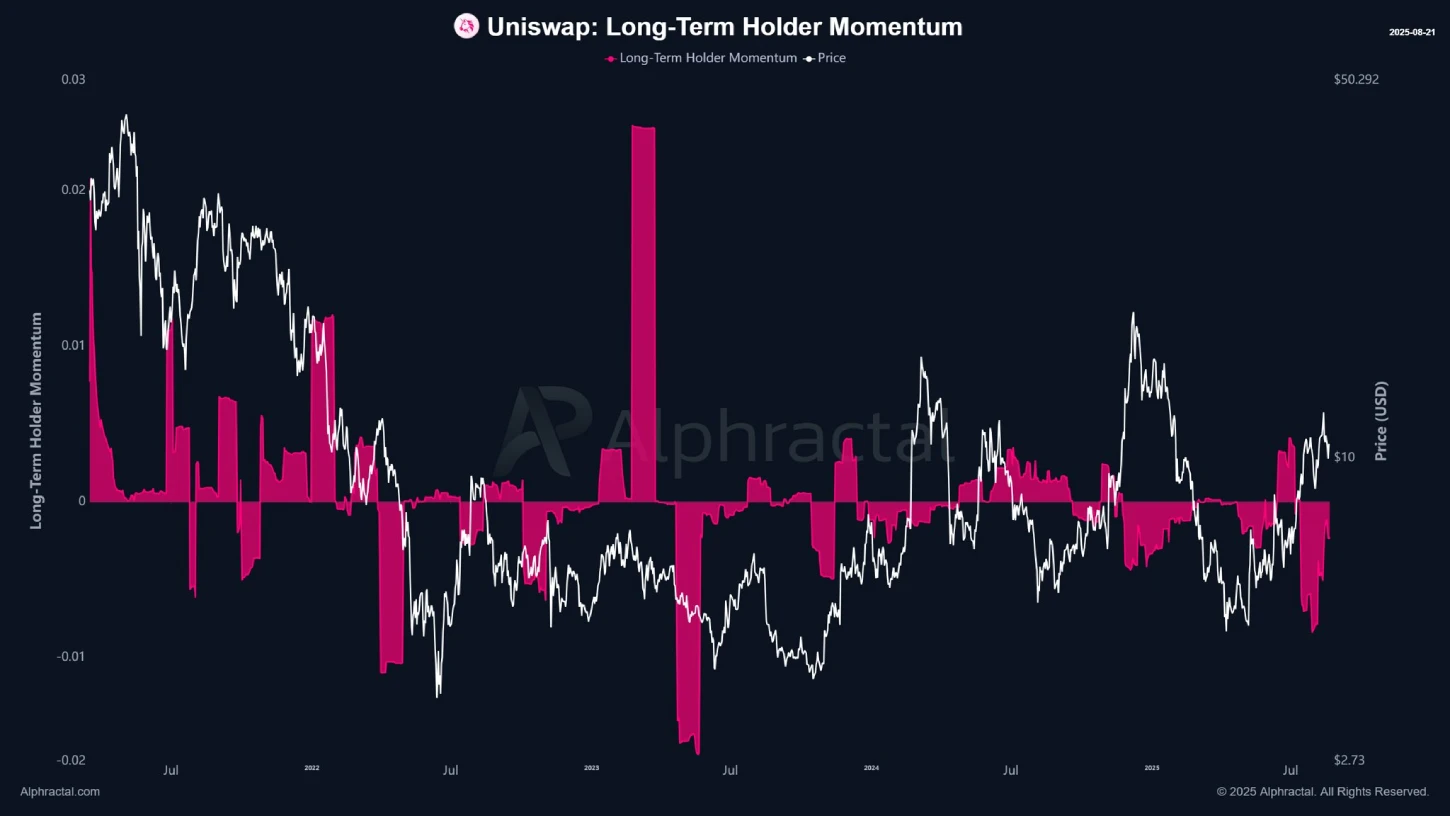
  • Uniswap’s Long-term holder (LTH) activity shows a sharp surge in active supply, indicating heavy distribution as prices rise.
  • Since December 2021, the UNI price has been ranging in a sideways trend within a $12.3 and $4.7 bottom support.

UNI, the native cryptocurrency of the decentralized cryptocurrency exchange Uniswap, plunged over 3% during Thursday’s U.S. market session to trade at 10.3%. The downtick aligns with a bearish momentum in the broader crypto market as investors scale back expectations of a Federal Reserve rate cut in September. However, the selling pressure mounts for the Uniswap price as long-term holders are actively distributing at a key resistance level. Is a breakdown below $9 a close, or do buyers have opportunities to counterattack?

Heavy LTH Distribution Raises Risk of Prolonged Downtrend in UNI

Over the past week, the Uniswap price has shown a V-top reversal from $12.3 to the current trading value of $10.28, registering a 16.4% loss. Subsequently, the asset market cap plunged to $6.47 billion. A majority of major cryptocurrencies, including Bitcoin, faced a similar pullback as investors’ hopes for a September rate cut plummet.

Adding to the bearish note, market analyst Boris highlights why the Uniswap coin struggles to maintain an upward momentum. Since December 2021, the altcoin has traded sideways, creating heavy liquidity positions on either side. The chart below shows a significant short liquidation cluster at $13.5 and a long liquidation zone near $8, creating a key pivot level for traders.

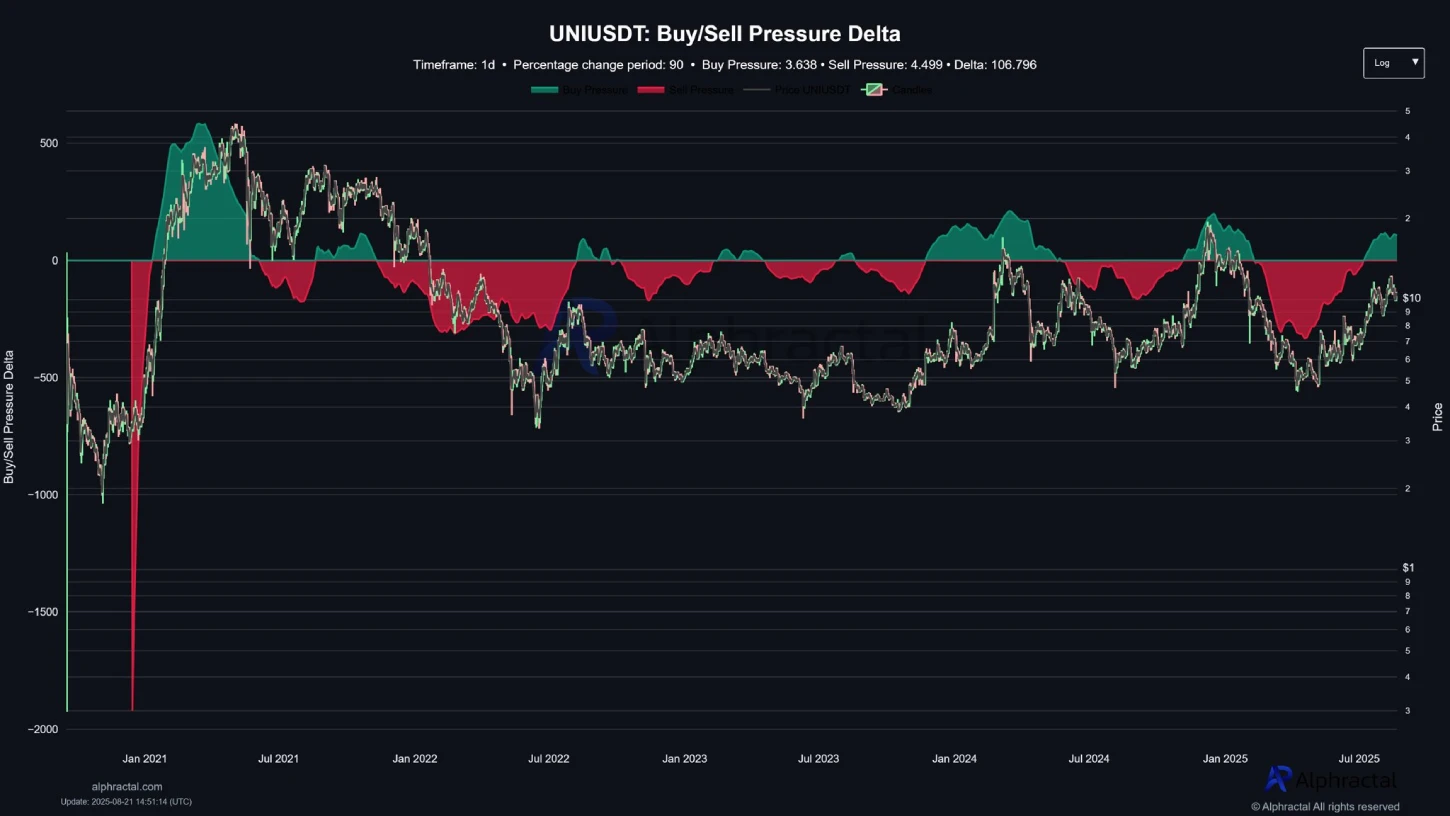
Along with recent market recovery, the Uniswap price recorded a surge in demand pressure, bolstering the asset’s potential breakout.  However, the on-chain flow suggests that large players are likely unloading positions through limit orders, creating a strong resistance near recent peaks.

The shared analysis highlights a notable surge in long-term holders’ active supply, signalling a heavy distribution trend as prices surge higher. This sell-the-bounce sentiment is common in an uptrend, signalling a risk for prolonged downfall. 

Meanwhile, the short-term holders (STH) activity shows that investors re-entered near the local top, marking a short-term peak. The market is now entering a stress test for STHs, with a correction likely as speculative positions unwind.

If this trend continues, the Uniswap price could struggle to hold its position above the $10 floor.

Uniswap Price Eyes Major Breakout Within Flag Pattern

The 4-hour chart analysis of Unicoin Price shows its current correction trend is strictly resonating within converging trendlines of a bull-flag pattern. The coin price bounced at least three times from the pattern’s resistance trendline and four times from the bottom trendline to create its strong influence on the price trajectory.

The chart setup is characterized by a long ascending trendline called ‘Pole” denoting the dominating trend in price, followed by a temporary correction within the converging trendlines to recuperate the existing bullish momentum. 

The coin price is positioned above the 100-and 200-day exponential moving average (EMA), indicating a broader trend in bullishness. Despite the intraday sell-off, the UNI coin price is less than 1% short of a bullish breakout from the overhead trendline

Thus, a potential breakout will accelerate the buying pressure in price and set a potential surge towards $12.3 resistance, signaling a nearly 20% growth.

Uniswap Price
UNI/USDT -1d Chart

However, if the market selling pressure persists, the coin price could face another reversal within the flag formation and drive a prolonged down towards $9.5 floor.

Also Read: Will Solana Price Break Lower by August End?

Will Solana Price Break Lower by August End?

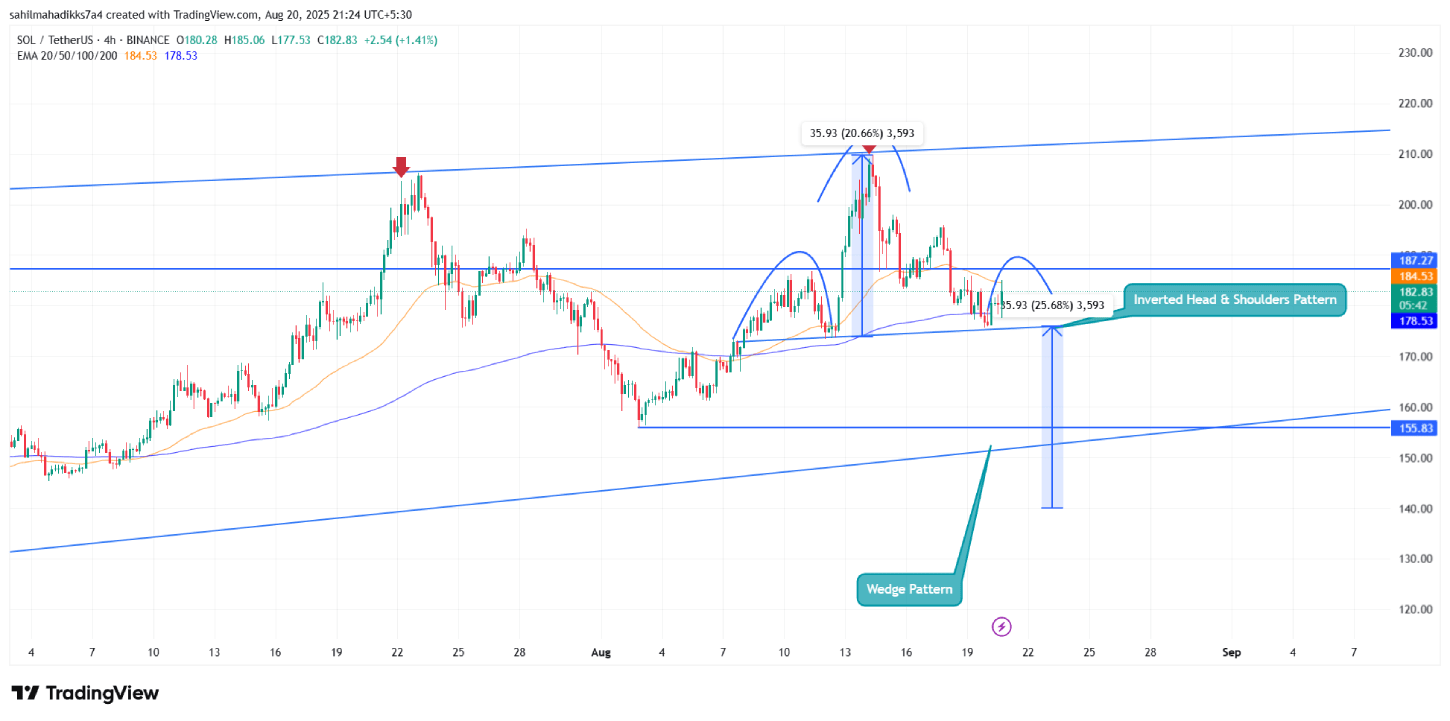
  • The Solana price is poised for a breakdown below $175 amid the formation of a head and shoulders pattern.
  • The number of active addresses on the network has dropped by 7% since last week, indicating a clear slowdown in user activity. 
  • A declining trend in SOL’s futures open interest records a 13% amid the recent market correction, signalling a waning interest from market participants.

The Solana price shows a sharp rebound of over 4.7% during Wednesday’s U.S. market hours to trade at $184.4. The buying pressure came as a relief rally in the broader crypto market after a sharp correction since last week. The declining trend in SOL futures open interest (OI) and the number of active addresses on the network is fueling prevailing bearish momentum in price, signaling a risk of bearish breakdown ahead. The formation of a technical chart pattern in the daily chart reveals how low the coin price could plunge by August’s end.

Solana Price Declines as Network Activity and OI Decline in Tandem

Since last week, the Solana price has shown a brief correction from $209.86 to a low of $175.6, accounting for a 16.28% loss. The pullback followed a broader market correction as Bitcoin dropped below the $115,000 floor amid U.S. macroeconomic developments.

Along with price correction, the number of active addresses on Solana dives from 2.91 million to 2.72 million, projecting a 7% loss. The active addresses reflect the user’s participation on the network, including transactions and interaction with decentralized apps.

Number of Active Addresses on Solana | TheBlock

Thus, the current decline suggests that fewer users are engaging with Solana during the price pullback, pointing to reduced confidence or short-term disinterest. 

Simultaneously, SOL’s futures open interest has dropped from $11.65 billion to $10.13 billion, registering a 13% drop. A $1.52B wipeout in OI signals that traders are closing their open positions in the futures market or getting liquidated.

This often happens after a heightened volatility, where leveraged positions are forced to liquidate and overall speculative pressure is dropped.

SOL Futures Open Interest | Coinglass

The dual drop in OI and active addresses indicates that both speculative traders and network participants are stepping back. If the trend continues, the coin price could face additional bearish momentum to drive a prolonged correction.

Adding to the bearish note, a crypto whale wallet identified as ‘91GShr’ unstaked 98,291 SOL (worth approximately $17.83 million) and deposited all of it to the Binance exchange just 30 minutes after Lookonchain reported.

With a risk of a potential sell-off, a bearish bias from large investors could further fuel the market selling pressure.

Solana Price Poised for Prolonged Correction from this Reversal Pattern

On the daily chart, SOL’s latest price rebound emerged from the $117.5 neckline support of an inverted head-and-shoulders pattern. The chart setup is characterized by three successive troughs, with the middle one extended high and two short swings.

Currently trading at $184, the Solana price is likely forming the final right shoulder of this pattern before the neckline breakdown. If the sellers manage to hold the asset below $187.30 resistance, the sellers could force a bearish breakdown at $175.00 support, accelerating the selling pressure.

The post-breakdown fall could push the price 11.5% down to test a key support level at $155.77. The aforementioned support coincides with a long-coming ascending trendline that has acted as dynamic support since April 2025.

The previous reversals from this support have led to price rallies ranging from 67% to 97%. Thus, the anticipated drop to $155.77 could act as a pivot point for the Solana price to change the current trend direction.

Solana Price
SOL/USDT – 1d Chart

On the contrary note, if today’s price breaks above the $187.3 resistance, the buyers could regain control over the asset for a higher rally.

Also Read: Will the SUI Price Correction Break $3 Floor?

Will the SUI Price Correction Break $3 Floor?

SUI price
  • A sharp decline in SUI futures open interest (OI) reflects the waning investors amid market uncertainty 
  • A bull flag pattern drives the current correction trend in SUI price.
  • The $3.14 floor, currently coinciding with the 200-day EMA, provides a high area of interest (AOI) for traders.

The SUI price shows a 5.1% decline during Tuesday’s market hours to currently trade at $3.45. The selling pressure aligns with Bitcoin’s pullback below $115,000 amid the macroeconomic development in the U.S. market. However, the SUI coin faces additional bearish momentum amid ‘sell-the-news’ market sentiment following the Robinhood listing and the declining trend in future open interest. Will the correction trend push this altcoin below the $3 floor?

Derivatives Activity Drops as SUI OI Contracts to $1.79B

Over the past three weeks, the SUI price shows a notable correction from $4.44 to the current trading value of $3.43, projecting a 23.16% loss. Subsequently, the asset market cap has dived to $12.13 billion. The bearish momentum deepened during Tuesday’s market hours as traders engaged in profit-taking following the short-lived boost from its Robinhood listing.

Amid the price pullback, the SUI futures open interest (OI) has also plunged from $2.66 billion to $1.79 billion, accounting for a 32% fall. The contraction in OI reflects a sharp decline in speculative activity as traders close their open positions in the market to brace for significant volatility.

Historically, such a sharp drop in OI value suggests a cooling speculative phase for buyers to regain exhausted bullish momentum.

SUI Futures Open Interest | Coinglass

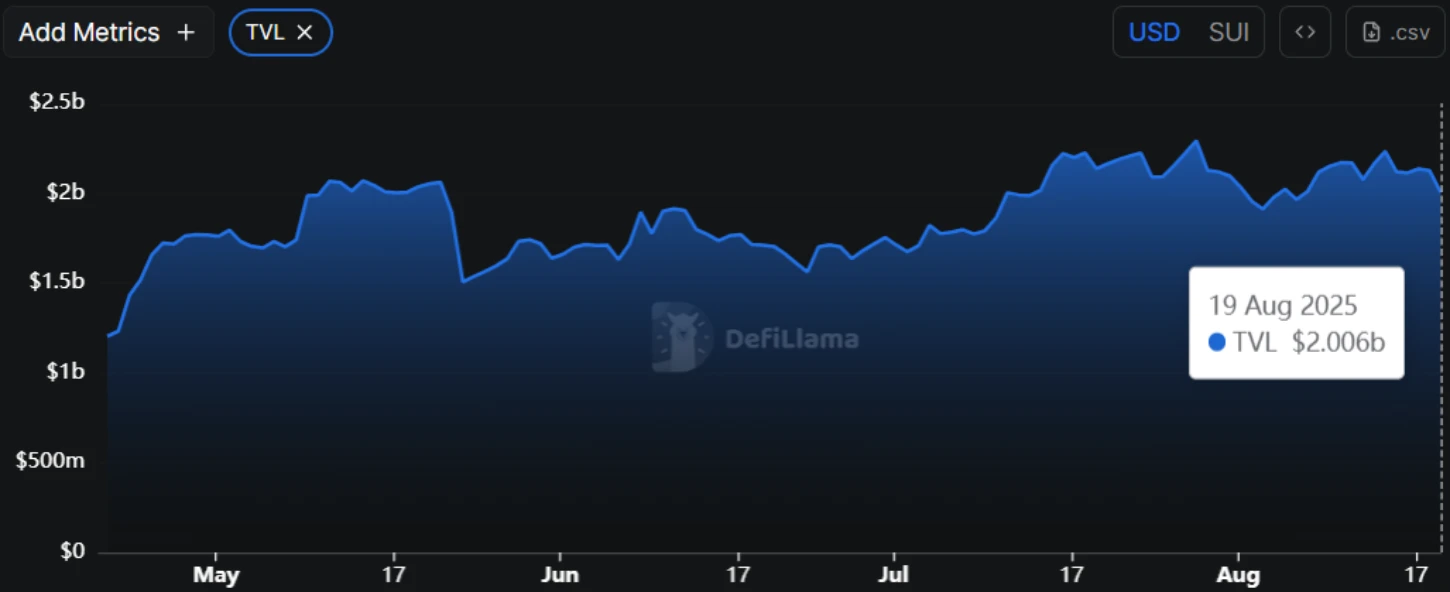
Simultaneously, the total volume locked (TVL) on the SUI network also declined from $2.13 to $2, showcasing a 6.13% loss. This drop in TVL indicates that investors are gradually pulling liquidity out of SUI’s DeFi ecosystem. 

SUI’s Total Volume Locked (TVL) | DefiLlama

A sustained weakness in TVL could weigh on SUI’s growth outlook. If the trend resumes, the coin price could face additional pressure and drive a prolonged downfall.

Also Read: Chainlink Price Defies Market Pullback With Whale Confidence; $30 Leap Next?

SUI Price for Major Support Test With Flag Formation

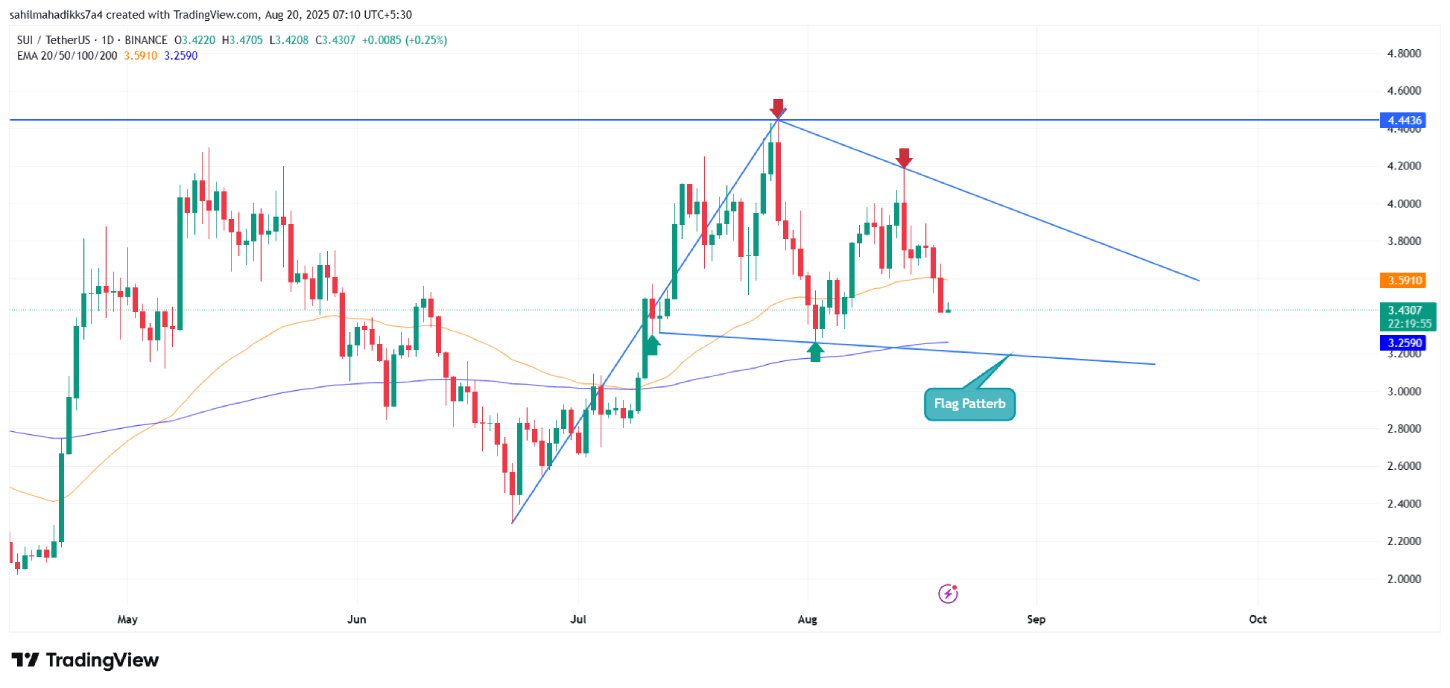
The SUI price analysis of the daily time frame chart shows the current correction trend is resonating within the bull flag formation. The chart setup is characterized by a long ascending trendline, reflecting the dominant trend in price, followed by two converging trends to drive a brief correction to recuperate bullish momentum.

The flag pattern is commonly spotted within an established uptrend, as it allows buyers to recoup the exhausted bullish momentum before the next leap. The coin price bounces at least twice from the pattern’s two trendlines and validates its credibility to influence future trend movements. 

Currently trading at the $3.44 mark, the SUI price is just 5.5% away from challenging the pattern’s bottom trendline at $3.14. With the broader market correction and declining trend in the future market, the sellers strengthened their grip over this asset. A bearish breakdown below the support trendline will accelerate the selling pressure and drive a prolonged correction of over 11% to hit $2.83 support, followed by a plunge to the $2.64 floor.

The $3.14 mark currently aligns with the 200-day Exponential Moving Average (EMA), establishing a key pivot level for this asset. If the buyers manage to hold this support, the bullish flag pattern will continue to develop and drive a potential price swing towards the overhead trendline.

Sui price
SUI/USDT – 1d Chart

A potential breakout from flag resistance will signal the continuation of prevailing recovery trend and support a bullish surge of over 15% to hit the $4.4 target.

Also Read: Blockchain Lender Figure Technology Files for $400M IPO

SEC Chair to Create “Future-Proof” Framework for Crypto

SEC Chair to Create “Future-Proof” Framework for Crypto

Key Highlights

  • SEC Chairman Paul Atkins reveals his top priority to create a “future-proof” regulatory framework for the crypto
  • This framework will provide crypto market protection against regulatory mischief
  • SEC fast-tracks a pro-innovation framework from the White House

In a thread posted on X (formerly Twitter), SEC Chairman Paul Atkins has revealed his top priority, which is the creation of a robust regulatory framework designed to “future-proof” the cryptocurrency markets. 

According to the thread, this impressive initiative comes from clear recommendations by the President’s Working Group on Digital Asset Markets. It is expected to move beyond reactive enforcement and instead build a resilient structure that protects innovation and investors.

“The President’s Working Group on Digital Asset Markets released clear recommendations for the SEC—and we’re setting out to implement them as soon as we can,” Paul Atkins said.  

“We must craft a framework that future-proofs the crypto markets against regulatory mischief. I look forward to working with my counterparts across the Administration and Congress to get the job done,” he added further. 

SEC’s Pro-Crypto Stance Opens Door for Friendly Regulations

The statement from SEC Chairman Paul Atkins was shared during a discussion at a blockchain event in Wyoming, which was part of the SALT Conference, and he posted about it online on August 20, 2025.

In his comments, he focused on his main goals as the head of the SEC, specifically talking about a new effort called ‘Project Crypto’ and his desire to make the process for companies to go public, known as IPOs, strong and attractive again. 

He brought up a recent report from a special group created by the President, which gave clear advice for the SEC on how to update its rules. This is all part of supporting President Donald Trump’s aim for the United States to become the leading global center for cryptocurrency. 

The way the United States government deals with cryptocurrency has changed a great deal in 2025 with the new administration, moving on from the previous strategy that relied heavily on legal punishments. 

Early in the year, the President signed an order to create a special working group focused on digital assets. This group, led by David Sacks, finished a report at the end of July that contained eighteen suggestions for improving the country’s position in financial technology. 

These ideas include creating better definitions for different types of digital assets, setting up safe testing environments for new products known as regulatory sandboxes, and making it possible to trade these assets under clear federal rules. 

The group has a very strict timeline to review current regulations, suggest changes, and deliver a complete plan for a new framework, which might even include the government building its own reserve of cryptocurrency from assets it has taken control of, all supporting the broader goal of American leadership in blockchain.

There has also been important movement on new laws in Congress. One significant bill that has passed the House of Representatives establishes wide-ranging rules for the crypto industry, and the Senate is now looking at comparable proposals. 

Other proposed laws are designed to clearly define which government agency, either the SEC or a different one called the CFTC, is in charge of overseeing various types of digital assets. 

For instance, one proposal suggests that assets on decentralized networks should be treated like commodities and regulated by the CFTC, while assets from centralized companies should be seen as securities and stay under the SEC’s watch. 

Furthermore, a new law about stablecoins, which are a specific type of cryptocurrency, was already signed into law early in the year, representing a major step forward for establishing clear rules for the industry.

In a noticeable change from the past, the SEC has temporarily stopped its aggressive legal actions against some of the biggest companies in the crypto space. 

This new approach of working with the industry is a big shift away from the previous method, which many felt was governed mostly by launching lawsuits and using an old legal test to argue that most cryptocurrencies should be considered securities. 

There are still some ongoing court cases that highlight the continuing debate over these issues, but the general direction is now toward finding clarity and cooperation instead of confrontation.

A central part of this new direction is the SEC’s own Project Crypto, which was officially started by Chairman Atkins at the end of July. The main objective of this project is to update the country’s securities rules to better fit the world of digital assets and to help make the U.S. the top market for crypto. 

The leader of this effort is Commissioner Hester Peirce, who has long been known for her supportive views on innovation. Similarly, Treasury Secretary Scott Bessent made a huge statement earlier, not once but twice. First, he declared that the federal government would not be buying more Bitcoin to expand its Strategic Bitcoin Reserve, a move that sent ripples through the crypto market. 

Chainlink Price Defies Market Pullback With Whale Confidence; $30 Leap Next?

Chainlink Price Analysis
  • Chainlink price could face a bearish pullback from $27.22 resistance and seek support from the $22.7 and $20 floor.
  • LINK futures open interest bounced to a $1.75 billion high, indicating the increasing conviction from derivative traders for a potential price jump. 
  • On-chain data shows a crypto whale bought 322,655 LINK (worth approximately $8.2 million) from the Binance exchange before the U.S. trading hours.

The Chainlink price witnessed heightened volatility during Monday’s U.S. market hours, reflected by a long-wick daily candle and only 0.55% growth. The sharp change in price movement was triggered by the clash between the broader market pullback and LINK’s growing demand among investors. Will this altcoin lose to the current market trend or hold its value to chase a higher target?  

LINK Price Rises Amid Whale Accumulation and Futures Boom

LINK, the native cryptocurrency of the decentralized oracle network, has seen a notable surge from $21 to its current trading value of $25.6, representing a 22% growth. Subsequently, the asset market cap has boost to 

The upswing reflects a firm conviction from buyers, as it came around a broader market pullback, which pushed Bitcoin below $117,000.

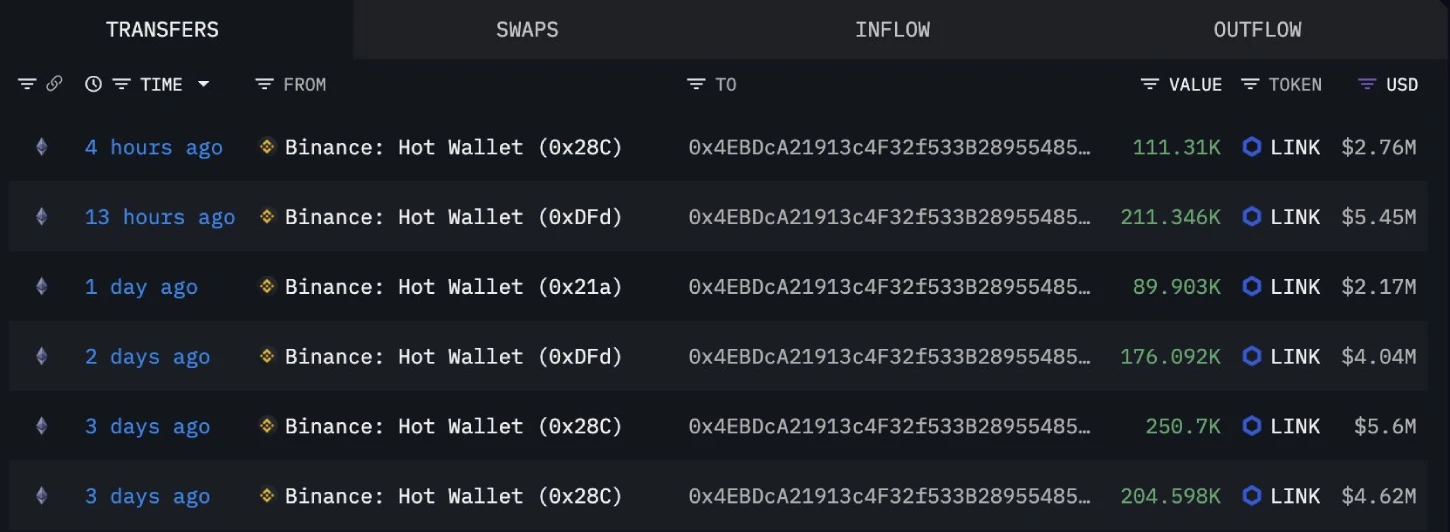
This current recovery in Chainlink price is backed by its increasing adoption and active accumulation from large investors. According to the on-chain tracker, Lookonchain, a crypto whale address ‘0x4EBD…’ withdrew 322,655 LINK (worth approximately $8.2 million) from the Binance exchange before the U.S. market hours.

Whale Activity | Lookonchain

Following the recent purchase, the whale’s withdrawals have reached 1,043,949 LINK (worth $24.64 million) over the past 3 days. The buying pressure reflects strong confidence from high-net-worth investors despite a market-wide correction.

Adding to the bullish note, the Open Interest (OI) data reflect a firm belief of future traders towards Chainlink’s potential price movement. According to Coinglass data, the LINK Futures OI value has taken a sharp surge from $1.22 billion to $1.75 billion in the last two days, reflecting a 43% bounce.

LINK Futures Open Interest | Coinglass

This increase indicates that traders are opening new positions in the market in anticipation of a major move. Typically, the rising OI with price indicates increasing long positions in the derivative market, which reflects the increasing bullish narrative for price. 

Also Read: Blockchain Lender Figure Technology Files for $400M IPO

Key Support To Watch in Chainlink Price Correction

Along with broader market recovery, the recent surge in Chainlink price recovery was a combined push from multiple factors, including the partnership with Intercontinental Exchange (ICE), the launch of the LINK reserve, institutional adoption, and growing appeal.

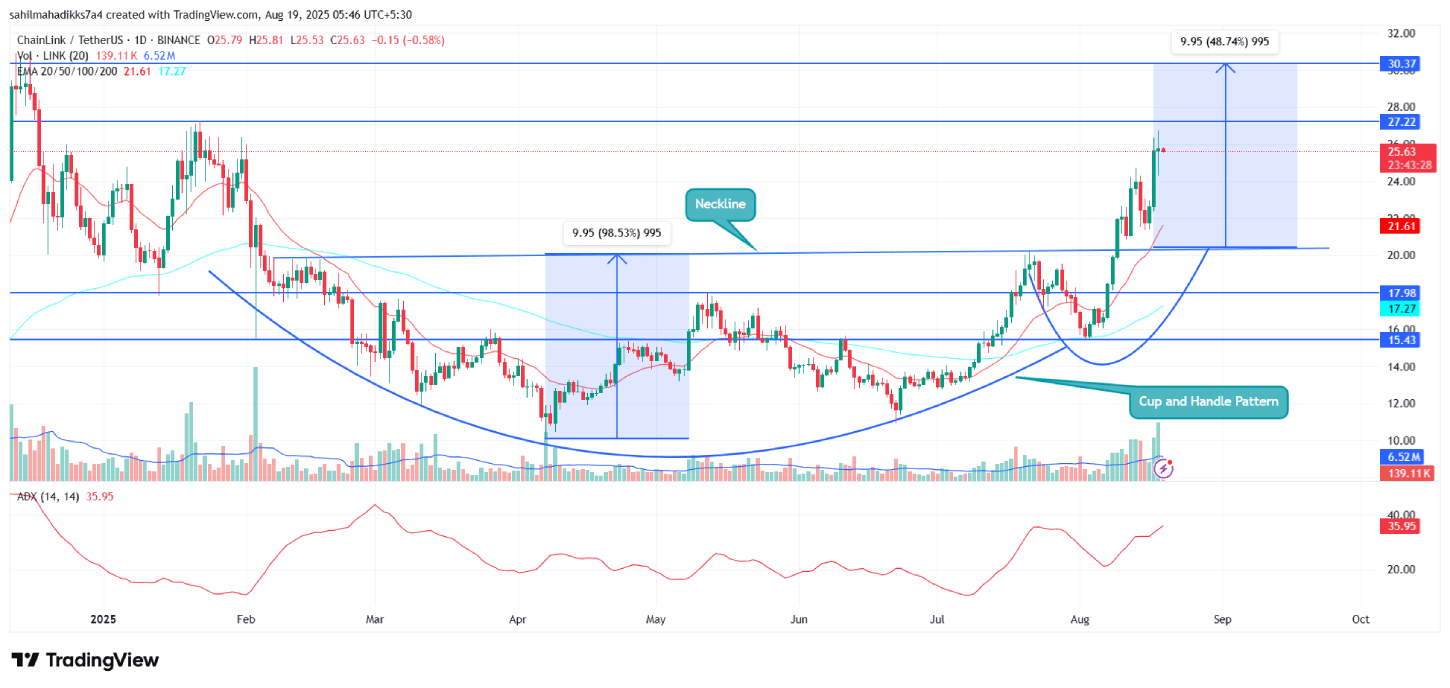
However, from the technical perspective, the price showed a textbook example of a cup and handle pattern. This chart setup is characterized by a long U-shaped accumulation zone followed by a temporary pullback to regain bullish momentum.

On August 9th, the coin price gave a decisive breakout from the pattern neckline resistance of $20, signaling the buyers’ win over a 6-month accumulation trend. Following the breakout, the Chainlink price gained significant momentum to reach the $25 mark.

However, the 4-hour chart shows overhead selling pressure at the $26 mark, evidenced by a long-wick rejection candle. If the market selling pressure persists, the coin price could enter a post-rally pullback to stabilize its current uptrend and recuperate the exhausted bullish momentum.

Chainlink Price
LINK/USDT – 1d Chart

The past trend of this uptrend shows a constructive pullback towards the 23.6% to 50% Fibonacci retracement level. Thus, the anticipated reversal in Chainlink price could seek support at the $22.7 and $20 floor, which coincided with the 23.6% and 32.6% FIB levels.

If the buyers manage to hold these levels, the coin price is likely to hit the $30 mark. 

Also Read: Dogecoin Price Eyes $0.26 as Whale Activity Sparks Buy-the-Dip Sentiment

Blockchain Lender Figure Technology Files for $400M IPO

Blockchain Lender Figure Technology Files for $400M IPO

Key Highlights

  • Figure reported $43.8 million revenue and a $29.1 million profit in H1 2025
  • The company has processed over $16 billion in loans using blockchain, proving DeFi can work at scale in real-world finance
  • If successful, Figure’s $400 million Nasdaq IPO could open the door for more crypto firms to enter public markets 

Figure Technology Solutions, a major player in blockchain-based lending, has officially filed for an initial public offering (IPO), aiming to list on the Nasdaq under the ticker symbol FIGR. 

This is not just another tech company going public. It is a crypto-native firm entering into the big leagues, proving that blockchain is not just about Bitcoin memes and wild speculation. It is about real money, real loans, and now, real stock market investors.  

Figure Seeks Public Market Debut

In the first half of 2025, Figure raked in $43.8 million in revenue, up more than 22% from the previous year. The company flipped a $13 million loss in early 2024 into a $29.1 million profit just a year later, according to the latest report.

That is the kind of turnaround that makes investors sit up and take notice. Since launching, Figure has handled over $16 billion in loans, all powered by blockchain tech. For an industry that critics once dismissed as a playground for hackers and day traders, this is a serious flex.  

One can think of Figure as a next-gen lender, which is one that cuts out the middlemen. Traditional banks take forever to approve loans, charge hefty fees, and keep borrowers in the dark. 

Figure uses blockchain to make lending faster, cheaper, and totally transparent. Whether it’s home equity lines of credit (HELOCs) or other loan products, the company has found a way to make decentralized finance (DeFi) actually work in the real world. And with interest rates still high, more people are turning to flexible options like Figure’s instead of dealing with slow-moving banks.  

The timing of this IPO is no accident. After quietly filing confidential paperwork with the SEC earlier this year, Figure is now making its move public, right as crypto is enjoying a fresh wave of investor hype amid bullish momentum in the major cryptocurrencies like Bitcoin and altcoins. 

Social media chatter, especially on X (formerly Twitter), has been buzzing with speculation that this could be the start of a new trend as the blockchain firms ditch the shadows and step into the stock market spotlight. 

Estimates suggest the IPO could raise around $400 million, though the final numbers are still up in the air.  

But Figure isn’t alone in this push. Over the past year, more crypto-related companies have been eyeing public listings, trying to shake off the industry’s risky reputation and prove they’re here to stay.

Bloomberg recently called it a “rush of crypto firms entering the market,” and if Figure’s IPO goes well, it could open the floodgates for others. The big question is whether Wall Street is ready to fully embrace blockchain.

The company is actually making money. Unlike so many crypto startups that burn through cash with little to show for it, Figure has turned a profit, kept costs under control, and shown that blockchain lending isn’t just theoretical. 

It is a viable business. That is a huge deal in an industry where even big names have collapsed under mismanagement and wild speculation.  

Still, challenges remain. The SEC has been cracking down on shady crypto projects, and while Figure’s focus on lending might help it avoid some regulatory landmines, nothing is guaranteed. 

But if all goes well, this could be a watershed moment. A successful IPO won’t just be a win for Figure, as it will be a win for the entire blockchain industry, proving that decentralized finance can stand shoulder-to-shoulder with traditional banking. 

Nasdaq, known for listing tech giants, seems like the perfect stage for this debut. And if Figure’s stock takes off, it could inspire a whole new wave of crypto companies to go public, blurring the lines between old-school finance and the blockchain revolution.  

Dogecoin Price Eyes $0.26 as Whale Activity Sparks Buy-the-Dip Sentiment 

Anonymous Wallet Gets Over $15 Million Worth of Dogecoin
  • The Dogecoin price indicates a potential bullish inverted head and shoulder formation, provided buyers manage to defend $0.211 support.
  • Market analysts highlight a renewed interest in Dogecoin whales as their transaction count hits a one-month high.
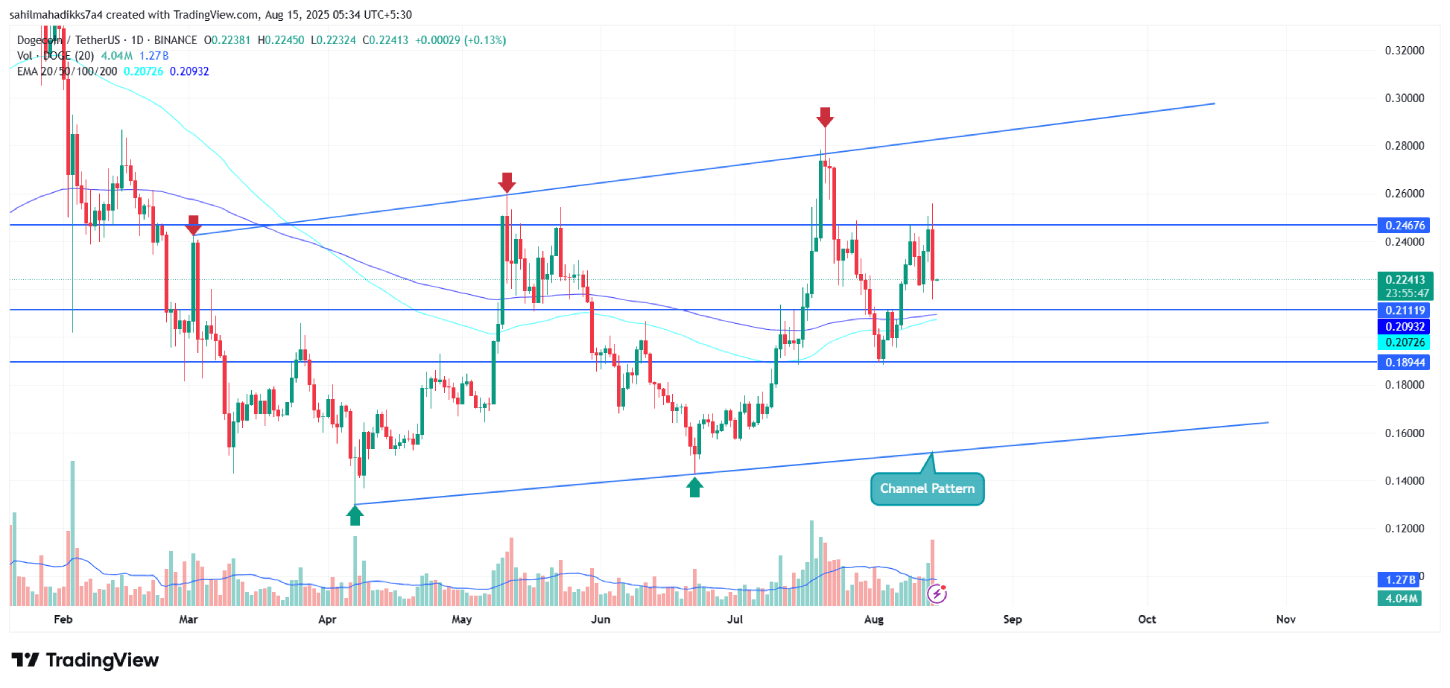
  • A rising channel pattern drives a 6-month accumulation trend in DOGE.
  • The flattish trend in 100-and-200-day exponential moving averages accentuates a mid-term sideways trend in this memecoin

DOGE, the largest main cryptocurrency by market cap, is down over 8.5% during the Thursday U.S. market hours to trade at $0.224. The selling pressure likely followed Bitcoin as it plunged below the $118,000 mark amid the regulatory and monetary developments in the U.S. market. As the memecoins are naturally volatile, they incur major movements during a fresh change in the market. However, the Dogecoin price shows potential for a bullish rebound amid the increased whale interest and formation of a bullish reversal pattern. Will the dog-themed coin reclaim $0.25?

Dogecoin Whale Activity Bullish Rebound

On Thursday, August 14th, the crypto market experienced a sudden sell-off, as evidenced by Bitcoin’s drop below $180,000 after reaching a new high of $124,517. The bearish momentum followed a recent comment from U.S. Treasury Secretary Scott Bessent, stating that the government is “not going to be buying” Bitcoin for its strategic reserve. 

The higher-than-expected U.S. July Producer Price Index (PPI) annual rate of 3.3% indicates a persistent inflationary pressure, which decreases the potential for an interest rate cut in September.

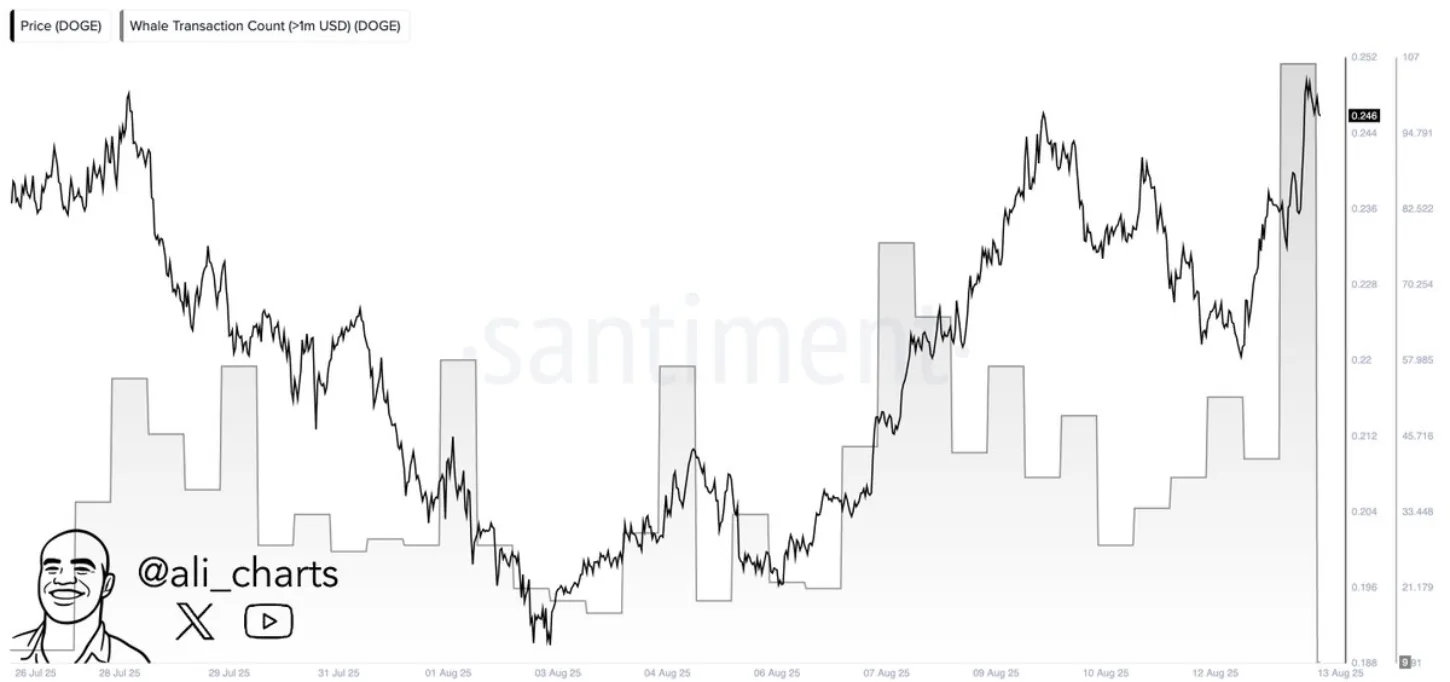
However, for Dogecoin, the intraday sell-off is countered by a renewed interest in high-net-worth investors. According to a recent tweet from market analyst Ali Martinez, the whale transaction count (>1 million USD) has recently hit a one-month high. 

Dogecoin Whale Activity | Santiment

This memecoin has been in a correction trend for nearly a month, indicating the recent on-chain data as buy-the-dip sentiment among whales. Historically, an accumulation trend from large investors has bolstered the coin price with renewed recovery and major reversals.

Dogecoin Price Eyes Bullish Reversal Amid Inverted Head and Shoulders Pattern

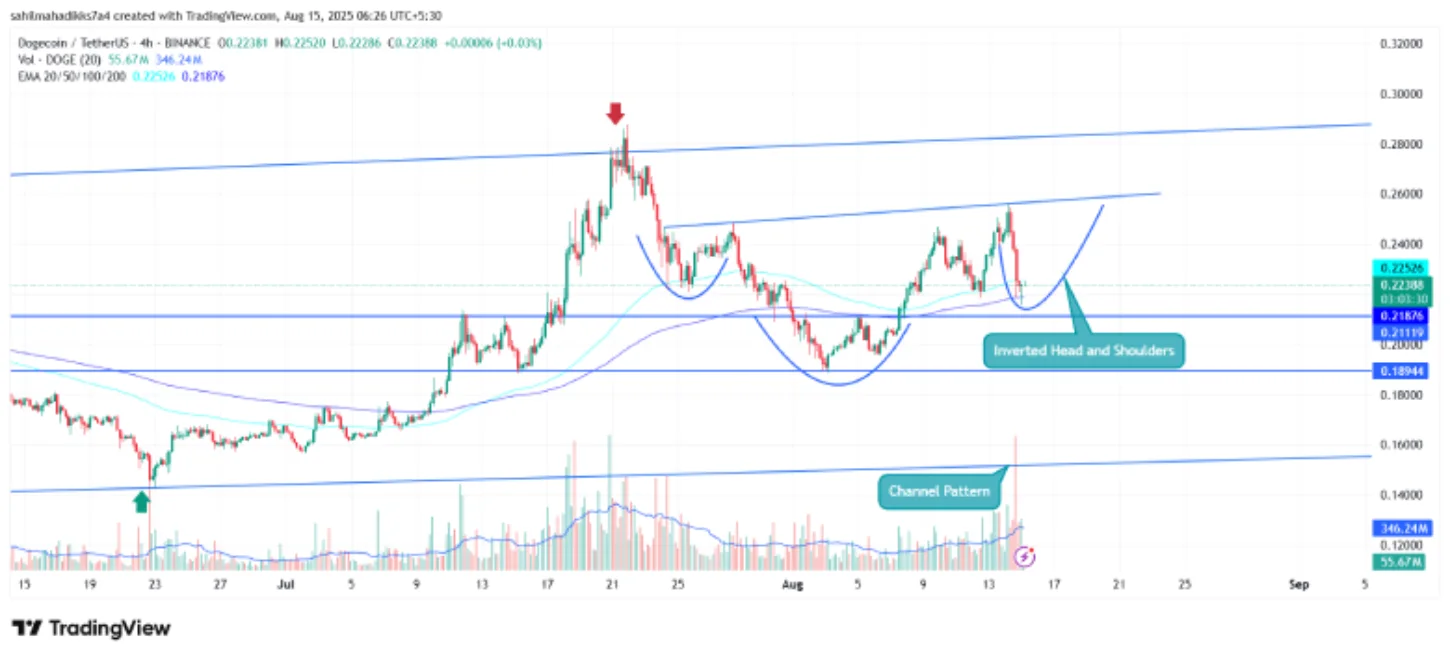
With today’s price drop, the Dogecoin price currently trades at $0.224 and holds its market cap at $33.77 billion. If the bearish momentum persists, the price could plummet another 5% and seek support at the $0.211 level. The horizontal floor coincides closely with the 100-and-200-day exponential moving average, creating a high rate of interest for buyers to recoup the bullish momentum.

If the support holds, this memecoin will also maintain its bullish reversal pattern of inverted head and shoulders in the 4-hour time frame chart. The pattern resembles an upside-down “head” with two smaller “shoulders” on either side, forming a V-shaped recovery. 

DOGE/USDT – 4 hour Chart

If the pattern holds true, the Dogecoin price could drive a strong rebound to the $0.26 mark and challenge the pattern’s neckline resistance for a breakout. The post-breakout rally could push the price another 10% before hitting the next significant resistance of the rising channel pattern at $0.28.

Since March 2025, the coin price has been resonating within the two parallel trendlines of this pattern, driving a steady sideways trend with a slight upward incline. The coin price reversed thrice from the overhead resistance trendline and twice from the bottom one, validating how strongly the pattern influences DOGE’s potential direction. 

Dogecoin Price
DOGE/USDT – 1d Chart

An anticipated surge to the pattern’s upper boundary could provide buyers with an opportunity for the bullish breakout and exit this long accumulation phase.

Also Read: Bitcoin Price Targets $132k With Next Breakout, But There’s a Catch