Friday, September 4, 2026
Home Blog Page 2

Bilateral Yen Support Leaves G7 Coordination Aside, Mike Dolan Notes

YEN

The United States-Japan intervention to back the yen garnered attention not only for its impact but also for those it excluded. The intervention was not a coordinated action by the major economies, but rather a bilateral action. “A coordinated global show of force was replaced by a transactional bilateral deal, weakening the effort and further dimming hopes of any grand bargain on exchange rates”, Reuters columnist Mike Dolan wrote.

Both U.S. Treasury Secretary Scott Bessent and Japanese Finance Minister Satsuki Katayama have publicly disclosed the reason and also mentioned their readiness to intervene again if the yen slides again. Therefore, the Yen has held its recovery from the multi-decade low of 164 per dollar. However, the decision to undertake the process without the other G7 members left some questions unanswered.

Unresolved Questions in the Markets

The first question is about the direction of Japanese monetary policy. Markets remain curious about whether the Bank of Japan will back the intervention with more aggressive interest-rate hikes. Another question focuses on American worries over the U.S. Treasury market.

As the largest foreign holder of Treasuries, Japan faced the possibility of having to sell some of those holdings to finance a prolonged campaign of dollar sales at a time of elevated bond-market volatility. The U.S. mitigated bond-market instability by routing dollars to Japan through Fed repos and selling euros to shore up the yen. Even if the common objective was to reverse the excessive yen weakness at levels not experienced in 40 years, the absence of the rest of the G7 should be explained.

A Bilateral Approach Takes Shape

This U.S-Japan intervention highlights a separate agreement within the G7 members, suggesting a pullback from the earlier multilateral approach.

Historical precedents highlight the utility of those frameworks. In 2011, a devastating earthquake and tsunami caused the yen to spike dangerously, prompting a unified G7 response to sell the currency. Prior to that, the last joint yen-buying operation occurred in 1998 during the Asian financial crisis, before the euro was introduced. Following the market disruptions after the attack on September 11, the three main G7 central banks responded together with liquidity in 2001.

The early struggles of the euro provide an instructive historical parallel. Persistent declines against the dollar and yen following its 1999 launch finally forced the European Central Bank (ECB) to intervene in late 2000. That campaign started with the joint G7 purchases of the euro, enabling the ECB to proceed and eventually stabilize the new currency. In the new case, other members of the G7 countries were not present. The United States conducted sales of euros for yen without the presence of Europeans. An ECB spokesperson declined to comment, and contact between the ECB and the Federal Reserve appears to have occurred only after the operation, said Mike Dolan.

Institutional Responses and Official Language

The International Monetary Fund, which monitors exchange-rate policies and external imbalances, did not make any comment. The French-hosted summits and finance talks of the G7 this year marginalized any discussion of exchange-rate coordination beyond the usual language of excessive volatility found in communiqués since 2017. “We also reaffirm our existing G7 exchange rate commitments,” the Evian G7 summit conclusions on the global economy and global trade imbalances stated in June. The language suggests minimal discussion even as the yen neared multi-decade lows.

Regional Pressures on Falling Yen

Yen’s further depreciation would also drag down the currencies of other trading partners, such as the South Korean won, as these economies try to maintain competitiveness against Japanese exporters. The Chinese yuan plays the most prominent role in that regional context, but is not part of the G7. Any wider discussion would await the G20 meeting scheduled for Miami later in the year.

Japanese Yen Weakens Ahead of Key U.S. Labor Market Report

Janapese Yen
Janapese Yen

The Japanese Yen showed slight weakness on Thursday, August 6, 2026, against the dollar during the Asian market hours. Currently, the USD/JPY pair is up 0.04% at 157.836, gradually unwinding the drop it witnessed during the U.S. and Japan’s intervention in the current market.

While the move temporarily boosted YEN’s strength and pushed the pair to 155.262 on Monday, August 3, 2026, the market participants are waiting for diplomatic developments in the Middle East and upcoming U.S. Labor Data. The key near-term catalysts for the yen are the perceived strength of official support, risk sentiment, and U.S. interest rates.

Intervention Support Provides a Floor

The yen’s relative strength this week has been buoyed by the market’s confidence that the authorities in Japan are ready to intervene if the currency slides into dangerously low levels. Although currency intervention effectively limited further USD/JPY losses from multi-decade extremes, the shallow recovery highlights structural vulnerabilities. Without continuous official defense or a shift in core macro fundamentals, speculative capital is highly likely to re-test the yen’s lows.

Geopolitical Calm Softens Safe-Haven Demand

The other major factor has been the removal of geopolitical risk premiums. Reports state that Iran and Oman are considering a security and trade pact that has helped temper near-term safe-haven buying of the dollar. Although unconfirmed by Washington, the draft framework suggests a potential decrease in tension in the Strait of Hormuz. That said, Brent crude futures are up again 1.35% today to $80.82 a barrel, wavering close to the price reached during a mid-June interim peace deal. The yen benefited modestly during the last drop in oil prices, which helped to improve Japan’s terms of trade, but the more immediate impact has been more widespread risk aversion.

“We haven’t got the oil market volatility that has really been the key driver of most markets in recent days and weeks,” Ray Attrill, head of FX strategy at National Australia Bank, said on a podcast.

U.S. Labor Data and Fed Signals in Focus

Economists suggest that non-farm payrolls will increase by 80,000 for the month of July, slightly above the 57,000 increase recorded in June, and the unemployment rate will stay at 4.2%. A weaker print would help support the Fed’s easing stance and help tighten the interest-rate spread that has been a headwind for the yen. A stronger figure would likely support the dollar and push USD/JPY higher.

The yen is expected to remain range-bound in the coming days as the official intervention still offers a bottoming floor, geopolitical tensions have abated, and a major U.S. data release is still to come. 

Yen Price Eyes Key Resistance Retest Before Next Dynamic

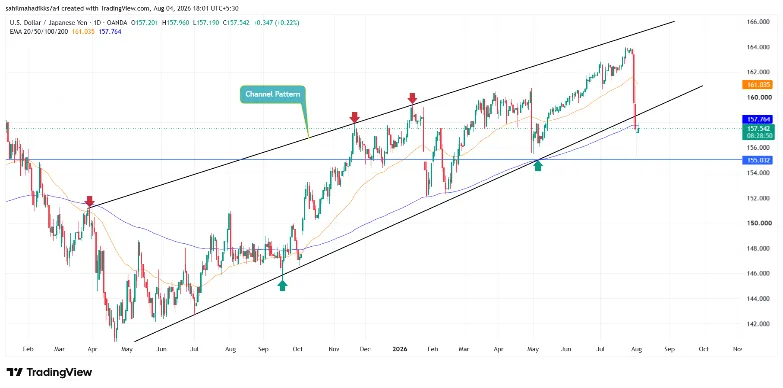
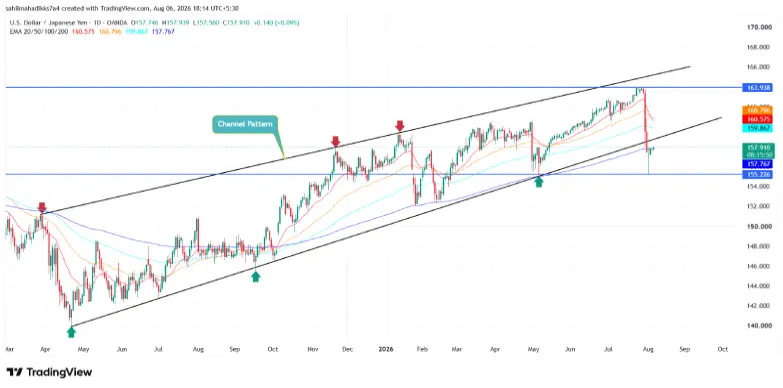
Amid the drastic fall during the U.S-Japan intervention in the current market, the USD/JPY pair gave a decisive breakdown below the support trendline of the rising channel pattern. Since late April 2025, the dynamic support of this pattern has acted as a high area of interest for currency traders and limited the Yen’s recovery against the dollar.

Following the breakdown, this ascending trendline can be perceived as a potential resistance level that could renew downside momentum in the USD/JPY pair. 

However, the exchange value could temporarily bounce to the 158.8 level and retest the breached support trendline before determining the next move.

If the pair shows sustainability below the breakdown point, the Japanese Yen could witness an accelerated recovery and drop to 155.26 per dollar. The recent downswing in daily exponential moving averages (20, 50, and 100) highlights the bearish pressure on this pair, supporting the potential recovery in the Japanese Yen.

YEN
USD/YEN – 1d chart

On the contrary, if the USD/JPY reenters the channel structure, the short-sellers could build additional conviction in YEN’s weakness and aim for the multi-decade low of 164.

Swiss Franc Gains as Middle East Deal Hits Safe-Haven Demand

Swiss Franc Rallies as Middle East Deal Hits Safe-Haven Demand

On Wednesday, August 5, 2026, the USD/CHF witnessed significant volatility as the dollar fell to an intraday low of 0.80742 against the Swiss franc in early trading hours before rebounding to the 0.80861 level. This choppy intraday volatility can be associated with a tug-of-war between easing geopolitical conditions and the nation’s monetary policy.

Swiss Franc Retreats as Geopolitical Premium Fades

The early morning rally in Swiss francs against the US dollar was triggered amid the diplomatic breakthrough in the Middle East. According to a report from AXIOS, the U.S., Iran, and Oman are closing in on an interim deal to reopen the Strait of Hormuz, with the U.S. aiming for a Wednesday announcement.

Under the proposal, Iran and Oman will set a 60-day temporary arrangement to allow safe passage through the waterways.

The progress quickly reduced the geopolitical risk premium that had supported the dollar for months. As systemic concerns eased, crude oil prices continued to decline globally. However, some institutions could reduce their purchases of the dollar as a safe haven and protectionist currency, a move that helped the Swiss franc and hurt the U.S. dollar.

The development comes as a sign of progress in an important energy choke point, with markets responding quickly to the potential for more stable shipping.

The Swiss Economic Reality Cushions the Slide

However, the Swiss franc’s rally proved short-lived as market participants shifted focus back to underlying economic data. A recently released macro report indicates that Switzerland is currently experiencing a very different inflation environment than the rest of the developed world.

In a recent currency research briefing, Elias Haddad, Senior Markets Strategist at Brown Brothers Harriman (BBH), observed that “Swiss July CPI stays muted.” The headline consumer price index printed at 0.4% year-over-year, dropping from 0.5% in June, while core CPI remained completely flat at 0.3% year-over-year for a fourth straight month.

The “bottom line,” according to Haddad, is that “the SNB has plenty of room to keep rates at 0.00% for some time, which is an ongoing drag for CHF.” This prolonged low-rate environment explains why “CHF is the worst performing G10 currency so far this quarter,” as yield-seeking investors continuously use the Swiss franc as a cheap funding currency.

Central Banks Express a Pragmatic Way Forward

The afternoon rally towards 0.80968 was also supported by a sharp reminder of the SNB policy stance. SNB Chairman Martin Schlegel recently reiterated that the SNB is in an “aggressive readiness” to actively intervene in foreign exchange markets. The SNB is still very much focused on a too-strong franc, as it risks harming small and medium-sized Swiss exporters, which are now pressing for a state-backed insurance policy against the franc’s appreciation

At the same time, the Fed’s interest-rate outlook continues to be largely data-dependent. While cooling global indices keep upcoming rate decisions volatile, the resilient underlying US economic engine prevents a wholesale abandonment of the greenback.

USD/CHF Pair Rides a Steady Uptrend within Channel Pattern

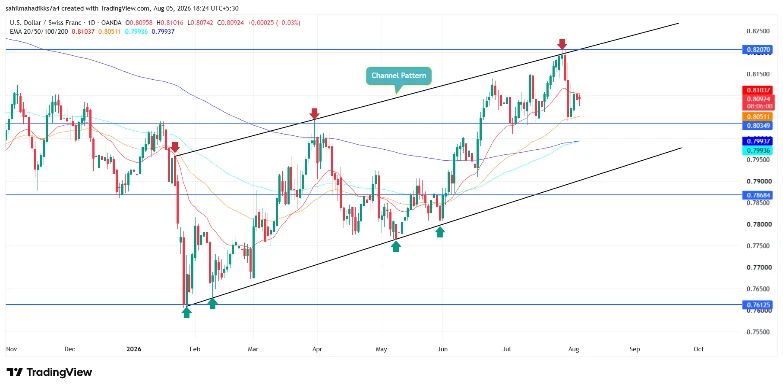
From the July 29th high of 0.820, the USD/CHF pair dropped to the current exchange value of 0.8095. While the recent strength in the Swiss franc came from easing geopolitical tensions, the technical chart projects its own theory with a channel pattern formation.

Since late January 2026, the pair has been resonating within two ascending trendlines that act as dynamic support and resistance for market participants. Historical trend shows a rebound from either trendline drives a price move to the opposite end of the channel.

Thus, the USD/CHF pair could continue its downward momentum and drop another 1.79% to hit the 0.794 floor and retest the channel support.

Swiss Franc
USD/CHF -1d Chart

The 0.8035 and 200-day exponential moving average at 0.800 stands as key immediate support for the pair, while the 0.820 level is the crucial horizontal resistance.

Japan & U.S. to Intervene Again if Yen Weakens, Ex-BOJ Official Says

Japan & U.S. Ready to Intervene Again if Yen Weakens, Ex-BOJ Says

Japan and the United States will “certainly” conduct more coordinated market interventions if the Japanese yen starts to decline again. The warning follows the heels of a large-scale, historic buy of the yen, which was able to pull the currency back from its multi-decade lows.

Pledging Conditional Return to the Market

According to former BOJ official Atsushi Takeuchi, the joint action successfully shattered expectations of a one-way market. “The fact the US stood behind Japan and took action has a huge symbolical meaning,” Takeuchi stated. “What has become clear is that there are effectively no constraints preventing Japanese authorities from intervening.

“This defensive alliance serves as a severe warning to aggressive currency speculators. “If I were running a hedge fund, I won’t think about making bets on USD/JPY now,” Takeuchi remarked. Analysts note that this symbolic threat carries massive weight, forcing traders to reconsider short positions to avoid fighting two global economic superpowers.

This is the same tone as that from the active administration itself. After the surprise coordinated action, Japanese Finance Minister Satsuki Katayama told reporters that Japan will not hesitate to engage in further coordinated action, an aggressive move that was immediately supported by the U.S. Treasury Secretary Scott Bessent.

Why the US Changed its Currency Strategy

Such coordinated foreign exchange operations are very rare and are a significant departure from the traditional U.S. financial policy, which emphasizes the free market valuation of currencies. Ultimately, Washington joined Japan in trying to prevent serious spillover risks into its own domestic bond markets.

Bond Contagion Fears  

The Japanese yen briefly hit a 40-year low against the dollar in July 2026, as it continued to weaken amid intense selling pressure. This coincided with a sharp sell-off in Japanese Government Bonds, sending yields to multi-decade highs. Japan is still the top foreign holder of U.S. Treasuries. Washington officials worried a further yen weakness would force Tokyo to sell off substantial amounts of its Treasury stock to get dollars to prop up the currency. Those sales could raise yields and loan rates in the U.S., including mortgage rates, incurring a wider financial hardship for many Americans.

The Federal Reserve Liquidity Backstop  

The United States provided an alternative liquidity channel to help limit this systemic risk. Treasury Secretary Scott Bessent confirmed readiness to expand the capacity of the Federal Reserve’s Foreign and International Monetary Authorities (FIMA) repurchase facility. It enables Japan to temporarily exchange its U.S. Treasury securities to the Fed for dollars. Tokyo is then able to buy yen with no bonds being sold into the open market, thus removing direct pressure on U.S. bond prices.

Market Implications and the Path Ahead  

The coordinated action worked, as the yen was brought from the danger zone near 164 to a better level at mid-to-low 155s. Macro analysts pointed out that U.S. involvement heightened the deterrence stakes and sent a message to big hedge funds and speculators that shorting the yen was a much riskier bet.

However, market watchers point out that the physical barriers are merely “short-term protection. The persistent yield differential between the higher-yielding Federal Reserve and the still relatively low rates at the Bank of Japan continues to weigh on the currency. The yen will stay structurally weak as long as Japan’s leaders delay a clampdown on expansionary fiscal policies and allow the BOJ to begin to increase rates more gradually. On both sides, officials have already said they are ready to re-enter the market if there is any disorderly move in the yen.

Technical Analysis: USD/JPY Breaks Major Uptrend Support

From the July 29th high of 163.908, the USD/JPY pair dropped to the current exchange value of 157.72, registering a drop of 3.72%. This pullback shows a decisive breakdown below the support trendline of a long-coming channel pattern in the daily time frame chart.

Since April 2025, the ascending trendline of this pattern acted as a dynamic support and constantly pushed YEN to higher exchange rates. Following this breakdown, the pair could potentially jump to 158.8 per dollar and retest the breached trendline as potential resistance. 

If the resistance holds, the YEN could gain additional strength and drop below 155 against the greenback.

YEN/Dollar
USD/JPY -1d Chart

The USD/YEN below the daily exponential moving averages (20, 50, 100, and 200) highlights a positive shift among traders.

Indian Rupee Extends Recovery Amid Oil Slump and Equity Rally

Indian Rupee Extends Recovery Amid Oil Slump and Equity Rally

The Indian Rupee (INR) registered a sharp gain of 27 paise against the U.S. dollar during Monday’s Asian market, marking an intraday low of 95.11, according to interbank foreign exchange data. This jump of roughly 0.30% from last Friday’s closing of 95.38 can be linked to domestic economic support and sudden shifts in global macroeconomics.

Rupee Jumps Amid Easing U.S.-Iran Conflict 

INR’s recent strength against the greenback followed immediate relief in global markets after U.S. President Donald Trump halted planned military strikes against Iran. According to a Truth Social statement on Sunday, August 2nd, Trump noted that while the U.S. was “locked and loaded and ready to go… at levels of Military Terror, Strength, and Power not seen since World War II,” a diplomatic pivot occurred. 

He stated, “We have just been asked by Iran, and other Middle Eastern countries, to hold off any attack in that the perimeters of a deal have been agreed to. “The agreement hinges on the “Immediate, Complete, and Total OPENING OF THE HORMUZ STRAIT,” a vital global oil shipping artery. This quick de-escalation defused the geopolitical risk premium from crude markets and dampened demand for the dollar as a safe-haven currency, helping the rupee’s rapid appreciation.

The Steep Retreat of Crude Oil Prices

On Monday, August 3, 2026, global energy markets saw a dramatic reversal, with international oil indexes tumbling as a result of U.S.-Iran diplomatic progress. Brent crude futures for the October 2026 futures contract fell 5% to $84 a barrel, reversing a significant portion of its +20% surge during the late July rally.

India relies heavily on imports to fulfill its domestic petroleum requirements, and therefore, the high energy prices directly balloon the country’s Current Account Deficit (CAD). This abrupt decline in energy prices directly eases the high imported inflationary pressures on India’s economy. 

Anticipation Ahead of RBI Monetary Policy

The major local driver for Indian currency this week is the Reserve Bank of India (RBI) monetary policy decision on Wednesday. Economists at ING Research expect the central bank to stay the course, saying, “We expect the RBI to keep the repo rate unchanged at 5.25% on Wednesday. 

ING analysts note that while “headline inflation surprised to the upside in June, largely due to higher fuel prices,” the broader macro picture remains stable. They emphasize that “underlying price pressures remain contained” and “core inflation continues to run below the RBI’s target,” giving policymakers room to pause while monitoring global inflation risks.

Inflow of Capital and Surging Forex Reserves

Robust domestic data and inflows of foreign capital are providing strong structural support to the Indian rupee. According to official NSE exchange data, Foreign Institutional Investors (FIIs) purchased equities worth ₹277.48 crore on a net basis on Friday. The general positive risk-on mood in the domestic equity market provides a steady supply of dollar inflows into the banking system.

The latest RBI data released on Friday shows the country’s forex reserves jumped by $6.118 billion to reach $682.354 billion for the week ended July 24.

On Monday, the equity benchmark, Nifty 50, jumped roughly 0.87% to reach 24,664.90 rupees, and the Sensex jumped 0.7% to hit 78,639.03.

Technical Analysis- USD/INR Hints at Further Decline Amid Reversal Pattern

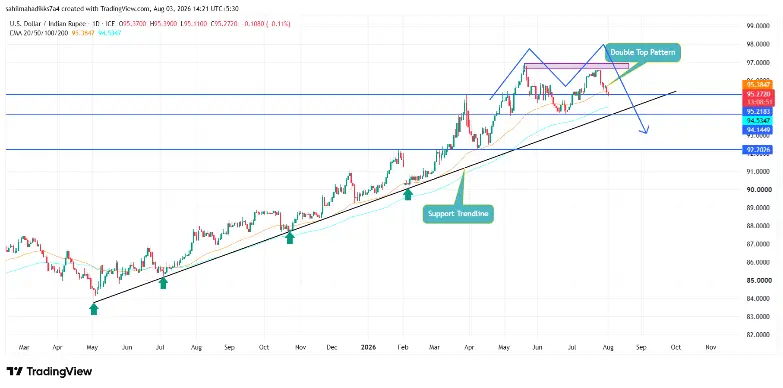
From the July 24 high of 96.67, the USD/INR pair has dropped roughly 1.39%— 1.34 Rupee— to reach the current trading value of 95.33. A broader analysis of the daily chart highlights a second price rejection from the 96.6-registering zone within three months, signalling a formation of a double-top pattern.

This classic bearish reversal pattern displays an ‘M’ shape structure to define intense overhead supply. If the bearish momentum persists, the Indian Rupee could breach the 95.22 support level against USD and drive an extended correction to 94.15.
This support stands as a pivot platform for the INR/USD pair as a long-coming support trend coincides at the same region.

Rupee against USD
Rupee against USD

Since May 2025, this ascending trendline has acted as dynamic support that prevents the Indian currency from entering a deeper discount against the greenback.

WFE Calls for Tokenized Stock Regulation Amid Boom

WFE Calls for Tokenized Stock Regulation Amid Boom

Key Highlights

  • The value of tokenized  stocks has surged rapidly, with their market capitalization exceeding $370 million 
  • The movement is being driven by major traditional finance firms like BlackRock, Fidelity, and Goldman Sachs
  • Major retail trading and crypto platforms such as Robinhood, Kraken, and Coinbase are racing to offer tokenized  stocks

The World Federation of Exchanges (WFE) has issued a formal call for regulatory action against the proliferation of ‘tokenized  stocks.’ 

This influential body, which represents over 250 exchanges and clearinghouses globally, contends that these blockchain-based instruments pose a substantial threat to investor protection and the fundamental integrity of established markets, according to the latest report.

“We are alarmed at the plethora of brokers and crypto-trading platforms offering or intending to offer so-called tokenized  U.S. stocks. These products are marketed as stock tokens or the equivalent to stocks when they are not,”  the WFE stated in a letter.

The move comes amid a growing institutional pushback against the rapid innovation occurring within the crypto sector, setting the stage for a pivotal regulatory clash.

What are tokenized  Stocks?

Tokenized equities are digital tokens, built on blockchain technology, that are designed to track the price of a publicly traded company’s shares. 

Crucially, however, purchasing these tokens does not confer actual ownership in the underlying corporation. Investors are not registered shareholders and thus lack critical rights, such as voting privileges or entitlement to dividends. 

WFE Raises Concern over Tokenized Stocks

Despite this fundamental difference, the WFE alleges that these products are frequently marketed to retail investors in a manner that misleadingly suggests equivalence to traditional stock ownership, creating a potentially dangerous misconception.

The WFE’s concerns, detailed in a letter to major international regulatory bodies, extend beyond investor confusion. The federation warns of a tangible risk to the reputational standing of the actual companies whose stocks are being mimicked. 

This argument is likely to resonate powerfully with regulators and publicly-listed firms alike, framing the issue as one of market-wide stability rather than mere technical compliance.

With prominent platforms like Robinhood and Coinbase advancing into this nascent space, the pressure on regulators to provide clear and enforceable guidelines is intensifying. 

The WFE’s position is unequivocal, which is that securities laws must be rigorously applied to these novel assets, legal frameworks for custody must be clarified, and marketing practices must be strictly policed to prevent misleading comparisons. 

The response from regulators will now be closely watched, as it will determine whether tokenized stocks can be integrated into the mainstream financial system or relegated to its periphery.

Earlier, the Securities Industry and Financial Markets Association (SIFMA) had asked the U.S. Securities and Exchange Commission (SEC) to reject requests from cryptocurrency companies seeking special permission to offer tokenized stocks. 

“SIFMA members have been reading with significant concern recent reports indicating that certain digital asset firms have submitted requests for immediate no-action or exemptive relief from requirements under the federal securities laws to allow such firms to offer investors the ability to purchase and trade tokenized equities or other digital forms of traditional securities through the firms’ platforms,” stated in an open letter. 

Boom in Tokenized  Stocks

Imagine a digital version of a company’s stock, like Apple or Tesla, but one that you can buy and sell online just like a cryptocurrency. These are called tokenized stocks. They’re built on blockchain technology, which allows for trading at any time of day, buying tiny fractions of a share, lower costs, and opening up access to investors all over the globe, often without the need for a traditional bank or broker.

The growth of these tokenized stocks in 2025 has been explosive. By the middle of the year, their total market value skyrocketed past $370 million after a huge 220% surge in their worth, creating a wave of excitement similar to the early days of decentralized finance. The amount of money being traded on certain platforms shot up from $15 million to a massive $100 million every single month.

This boom is being led by some of the biggest names in finance. Giant firms like BlackRock, Fidelity, and Goldman Sachs have started offering these products, helping to push the total value of tokenized company shares to over $50 billion. 

Companies are eager to get involved because turning stocks into tokens creates new opportunities and makes markets run more smoothly.

Popular trading apps are joining in, too. Robinhood, for instance, made over 200 tokenized stocks available for its users in Europe, even including shares from private companies like OpenAI. This move was so popular it helped drive Robinhood’s own stock price to an all-time high. Other major crypto exchanges are also racing to launch their own approved versions.

Bitcoin Calm Before the Storm? Active Supply Dip Leaves Room for Breakout

Bitcoin Soars Above $119,000 after Dipping Below $113,00
  • Bitcoin’s 30-day active supply in decline shows a slowdown in market activity to build the next major move.
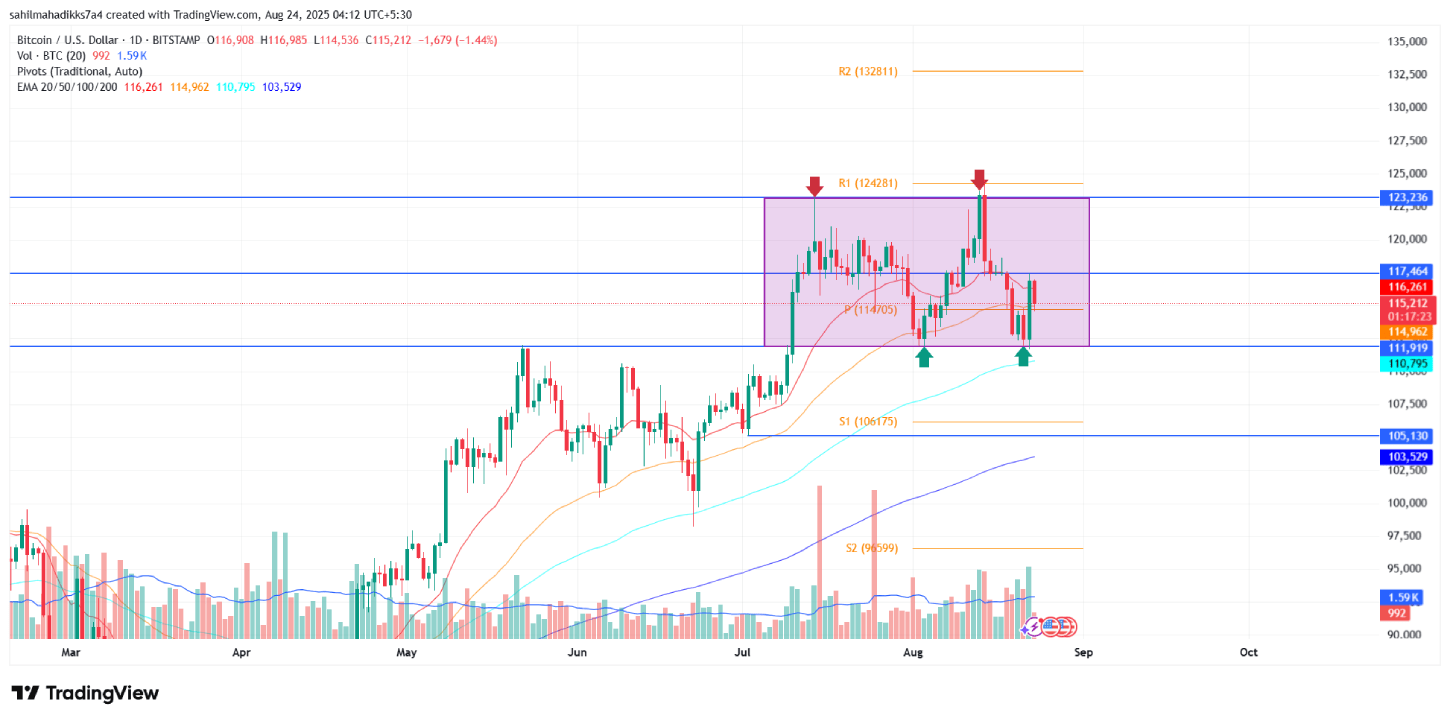
  • The Bitcoin price drives a short consolidation trend between the $123,236 and $111,999 horizontal levels.
  • BTC’s fear and greed index dropped to 60%, indicating a greed sentiment among market participants for higher recovery.

The renewed recovery in Bitcoin price took a short pullback on Saturday, August 23rd, where it dropped over 1.5% to trade at $115,273. However, this selling pressure backed by weak volume indicates a lack of conviction from sellers and higher potential for bullish continuation. The recent slowdown in BTC’s supply movement further accentuates that the market is shaping up for the next big move. Will the top cryptocurrency climb towards $130,000, or is a major correction looming?

Supply Movement Cools Off as Bitcoin Prepares for Next Major Move

Last Friday, the Bitcoin price showcased a sharp rebound from $111,919 weekly support with nearly a 4% gain. A primary catalyst behind this jump was Federal Reserve Chair Jerome Powell’s remarks at Jackson Hole, where he hinted at potential interest rate cuts amid shifting economic risks.

Despite Powell’s cautious tone, the market optimism bolstered a majority of major cryptocurrencies for a sharp rebound. However, the recovery took a slowdown on Saturday, and BTC plunged to $115,273 with a 20% fall in trading volume. The lower volume during the pullback suggests reduced selling pressure, leaving room for a potential recovery if buyer participation strengthens.

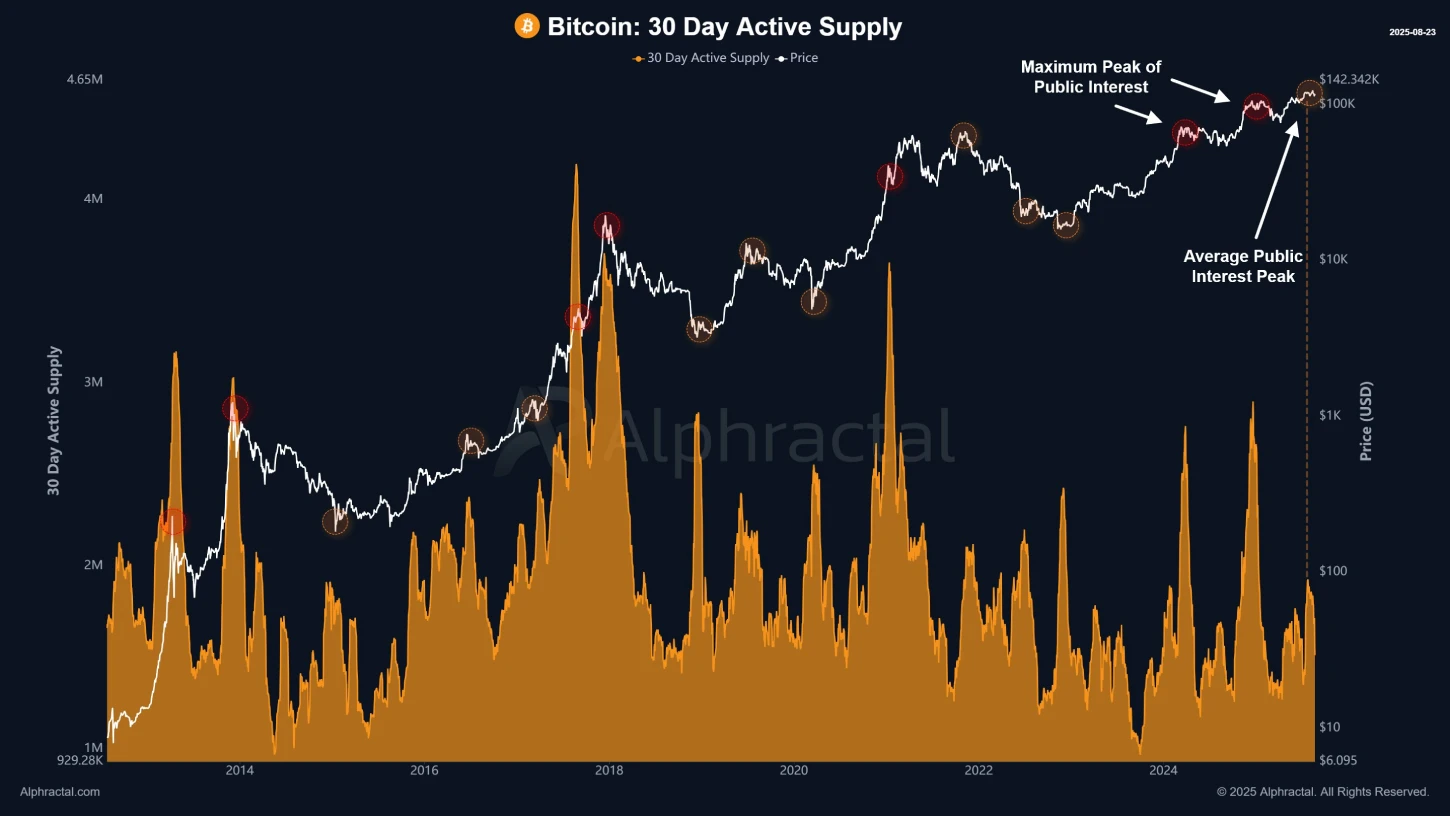
Low volume often allows buyers to build bullish momentum for the next leap. The latest on-chain data on Bitcoin’s 30-day active supply supports this bullish narrative. This metric tracks the number of unique coins moved in the past month, acting as a thermometer of market interest in BTC.

A rising trend in this metric suggests fresh capital inflow and stronger investor activity. Historically, these spikes have aligned with market tops and bottoms, as greed or fear often drives investors to move coins rapidly. 

Bitcoin 30-Day Active Supply | Alphractal

On the other hand, a declining trend in BTC’s 30-day active supply shows a quieter phase, with fewer coins in motion. Such a cooldown typically follows periods of extreme activity.

At present, Bitcoin’s supply movement has slowed down, suggesting a clearer backdrop after a recent surge in market enthusiasm. This moderation could provide the Bitcoin price a short breather to build its momentum for its next major move.

Bitcoin Price Enters Post-Rally Consolidation

The short-term trend analysis of the Bitcoin price shows a sideways shift to its prevailing recovery phase. Over the past six weeks, the coin price has reversed twice from the overhead resistance of $123,236 and bounced twice from the newfound support of $111,999, indicating a consolidation trend in action.

Following the July rally, this lateral trend could allow buyers to recuperate the exhausted bullish momentum before the next breakout. The coin price trading above the daily exponential moving average (20, 50, 100, and 200) accentuates the broader market sentiment.

Currently, the coin buyers are struggling to breach the midline resistance of this consolidation trend at $117,838. If the buyers flip this resistance to support, an accelerated bullish momentum could push BTC price against all-time high resistance at $123,236.

A potential breakout with a daily candle closing will signal the continuation of the prevailing uptrend, with the traditional pivot level indicating the next key resistance at $138,820.

Bitcoin Price
BTC/USDT -1d Chart

On the contrary, if the sellers force a breakdown below the $111,900 support, the coin price could enter a deeper correction towards the $105,357 mark.

Also Read: Grayscale Files for XRP ETF, Soars 7% in a Day

Grayscale Files for XRP ETF, Soars 7% in a Day

Grayscale Files for XRP ETF, Soars 7% in a Day

Key Highlights

  • Grayscale submits S-1 for spot XRP ETF
  • This filing comes after landmark legal clarity on XRP status
  • Joins wave of filings for institutional access

On August 22, Grayscale Investments, an entity whose name carries considerable weight in the corridors of both Wall Street and the cryptocurrency world, formally initiated the process with the U.S. Securities and Exchange Commission (SEC) to launch a spot exchange-traded fund for the digital asset XRP. 

Grayscale XRP ETFs(Source: Watcher.Guru on X)

The filing shows a potential paradigm shift, which offers a bridge for traditional capital to access the efficiencies of decentralized payment networks through a familiar and structured vehicle.

Grayscale XRP ETF Filing

The proposed fund’s architecture is critical to understanding its implications. As a spot ETF, the product would be directly backed by physical reserves of XRP, held in secure, institutional-grade custody.

This structure is important as it provides investors with pure exposure to the asset’s market performance, untethered from the complexities and potential contango associated with futures-based derivatives. 

For the institutional investor, this means a streamlined, compliant pathway to gain exposure to an asset class previously mired in operational complexity. 

It demystifies the process, transforming a digital token into a tradable security on a major national exchange, complete with the expected regulatory oversight and reporting transparency.

This ambitious proposal does not emerge from a vacuum. Its very possibility is predicated upon a hard-fought legal and regulatory clarification. 

This filing comes amid upward momentum in XRP tokens as it soared over 7% in a day. At the time of writing, the token is trading at around $3.06, according to CoinMarketCap.

The shadow that once loomed over XRP, cast by the Securities and Exchange Commission’s lawsuit against Ripple Labs Inc., has largely receded following a series of pivotal judicial rulings. 

A federal judge’s determination that XRP is not in itself a security when traded on secondary exchanges effectively dismantled the primary barrier to its consideration for such a product. 

This legal precedent, now solidified, has recontextualized XRP within the regulatory framework, aligning it more closely with commodities like bitcoin and ether, which have already secured this coveted ETF status. The filing is, in many ways, the first major fruit of that legal labor.

Grayscale’s entry into this arena adds a potent catalyst to an already active field. They are not a lone voice but rather a powerful participant in a growing chorus of asset managers, including firms like Bitwise and Franklin Templeton, who have submitted similar applicatio

The near-synchronized timing of amended S-1 filings from several issuers suggests a coordinated push, often interpreted by market analysts as a sign of ongoing, productive dialogue with regulators. 

The SEC’s deliberate pace in reviewing these applications, extending its deliberation period rather than issuing dismissals, is itself viewed by many seasoned observers as a cautiously optimistic indicator. 

The involvement of an established player like Grayscale, with its successful history of converting a trust into a spot bitcoin ETF, lends considerable credibility and momentum to the entire endeavor.

The ramifications of a successful launch extend far beyond mere price speculation. Approval would represent a seminal moment of validation for the underlying utility of the XRP Ledger, which is engineered for the rapid, low-cost settlement of cross-border payments. 

It would grant pension funds, endowments, and retail investors alike the ability to gain exposure to the growth of this blockchain-based financial infrastructure through their existing brokerage accounts. 

This legitimization has the potential to accelerate adoption among financial institutions, enhance overall market liquidity, and further cement digital assets as a permanent and innovative component of the global financial system. 

The Grayscale filing is more than a proposal; it is a bellwether for the industry’s continued march toward integration and acceptance.

Uniswap Price Eyes $10 Breakdown as Long-Term Holders Sell Into Strength

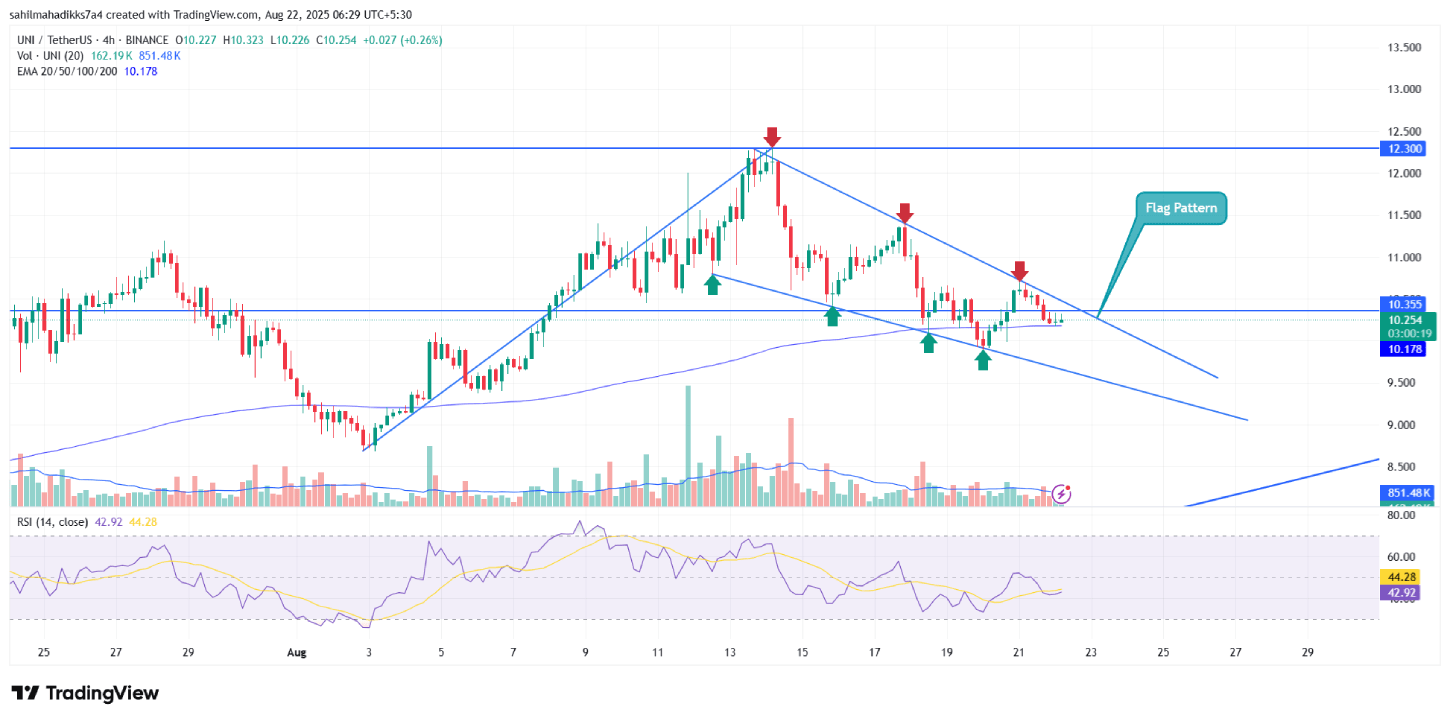
  • The formation of a bull flag pattern drives the current correction trend in Uniswap price.
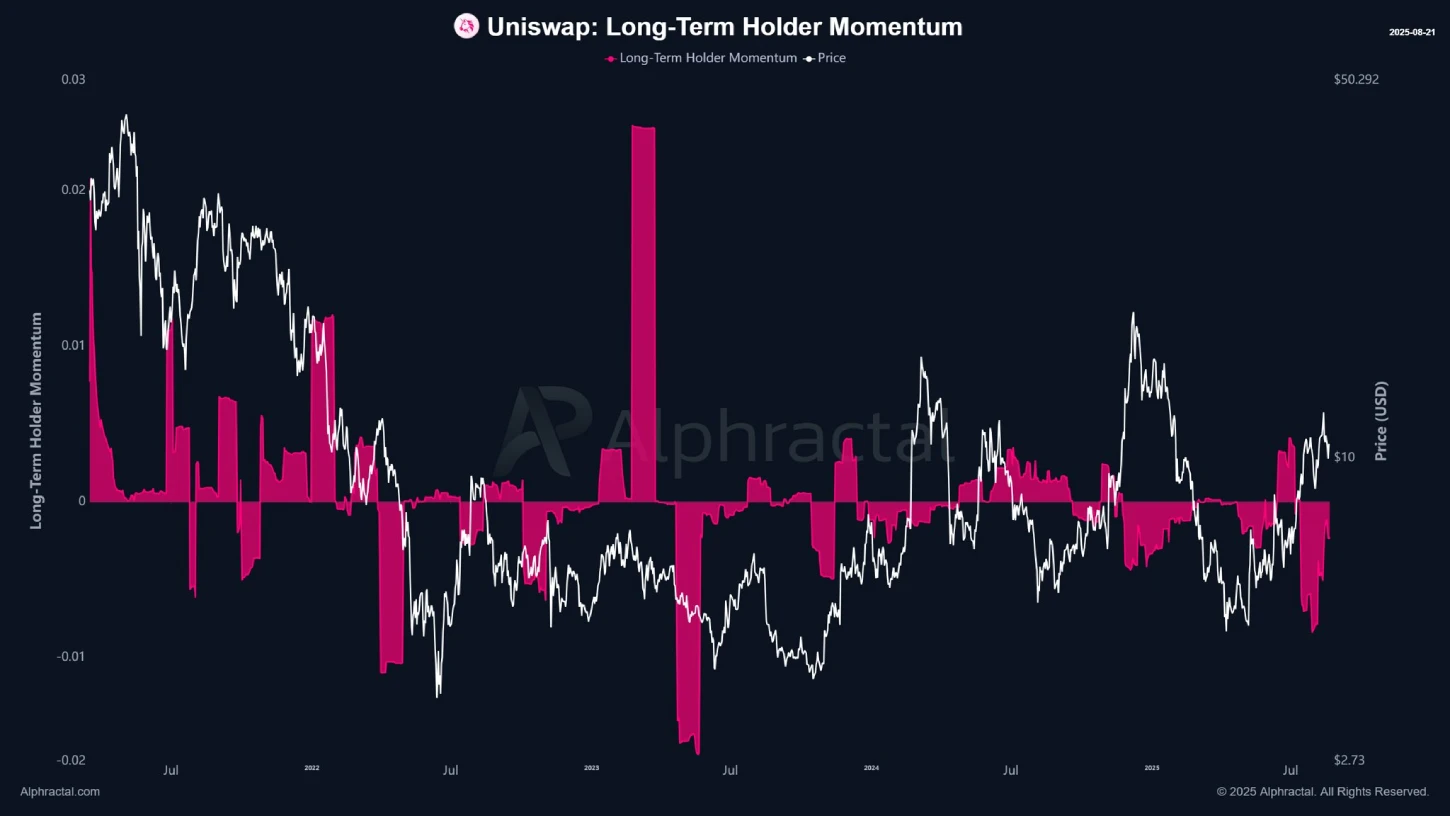
  • Uniswap’s Long-term holder (LTH) activity shows a sharp surge in active supply, indicating heavy distribution as prices rise.
  • Since December 2021, the UNI price has been ranging in a sideways trend within a $12.3 and $4.7 bottom support.

UNI, the native cryptocurrency of the decentralized cryptocurrency exchange Uniswap, plunged over 3% during Thursday’s U.S. market session to trade at 10.3%. The downtick aligns with a bearish momentum in the broader crypto market as investors scale back expectations of a Federal Reserve rate cut in September. However, the selling pressure mounts for the Uniswap price as long-term holders are actively distributing at a key resistance level. Is a breakdown below $9 a close, or do buyers have opportunities to counterattack?

Heavy LTH Distribution Raises Risk of Prolonged Downtrend in UNI

Over the past week, the Uniswap price has shown a V-top reversal from $12.3 to the current trading value of $10.28, registering a 16.4% loss. Subsequently, the asset market cap plunged to $6.47 billion. A majority of major cryptocurrencies, including Bitcoin, faced a similar pullback as investors’ hopes for a September rate cut plummet.

Adding to the bearish note, market analyst Boris highlights why the Uniswap coin struggles to maintain an upward momentum. Since December 2021, the altcoin has traded sideways, creating heavy liquidity positions on either side. The chart below shows a significant short liquidation cluster at $13.5 and a long liquidation zone near $8, creating a key pivot level for traders.

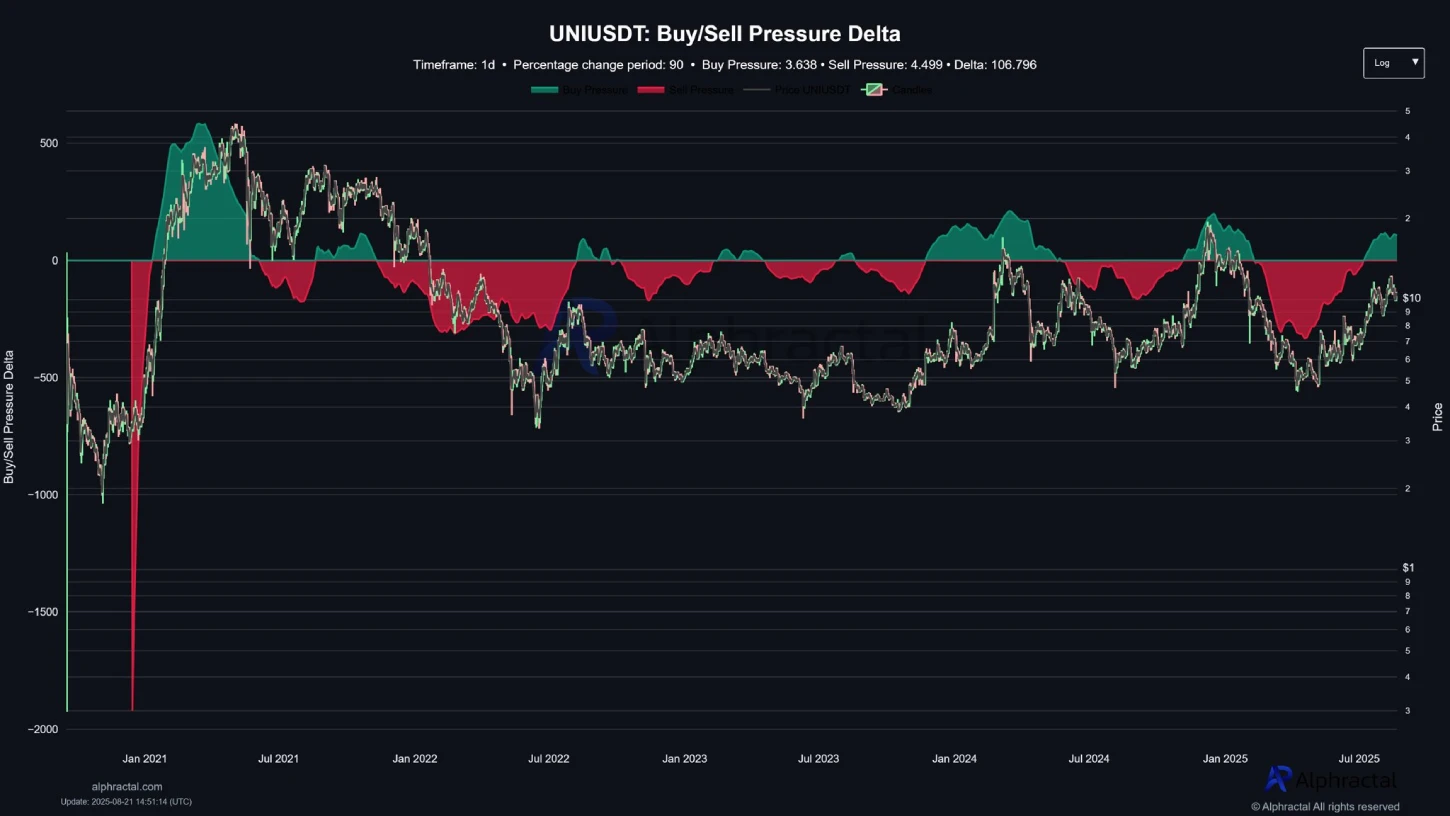
Along with recent market recovery, the Uniswap price recorded a surge in demand pressure, bolstering the asset’s potential breakout.  However, the on-chain flow suggests that large players are likely unloading positions through limit orders, creating a strong resistance near recent peaks.

The shared analysis highlights a notable surge in long-term holders’ active supply, signalling a heavy distribution trend as prices surge higher. This sell-the-bounce sentiment is common in an uptrend, signalling a risk for prolonged downfall. 

Meanwhile, the short-term holders (STH) activity shows that investors re-entered near the local top, marking a short-term peak. The market is now entering a stress test for STHs, with a correction likely as speculative positions unwind.

If this trend continues, the Uniswap price could struggle to hold its position above the $10 floor.

Uniswap Price Eyes Major Breakout Within Flag Pattern

The 4-hour chart analysis of Unicoin Price shows its current correction trend is strictly resonating within converging trendlines of a bull-flag pattern. The coin price bounced at least three times from the pattern’s resistance trendline and four times from the bottom trendline to create its strong influence on the price trajectory.

The chart setup is characterized by a long ascending trendline called ‘Pole” denoting the dominating trend in price, followed by a temporary correction within the converging trendlines to recuperate the existing bullish momentum. 

The coin price is positioned above the 100-and 200-day exponential moving average (EMA), indicating a broader trend in bullishness. Despite the intraday sell-off, the UNI coin price is less than 1% short of a bullish breakout from the overhead trendline

Thus, a potential breakout will accelerate the buying pressure in price and set a potential surge towards $12.3 resistance, signaling a nearly 20% growth.

Uniswap Price
UNI/USDT -1d Chart

However, if the market selling pressure persists, the coin price could face another reversal within the flag formation and drive a prolonged down towards $9.5 floor.

Also Read: Will Solana Price Break Lower by August End?

Will Solana Price Break Lower by August End?

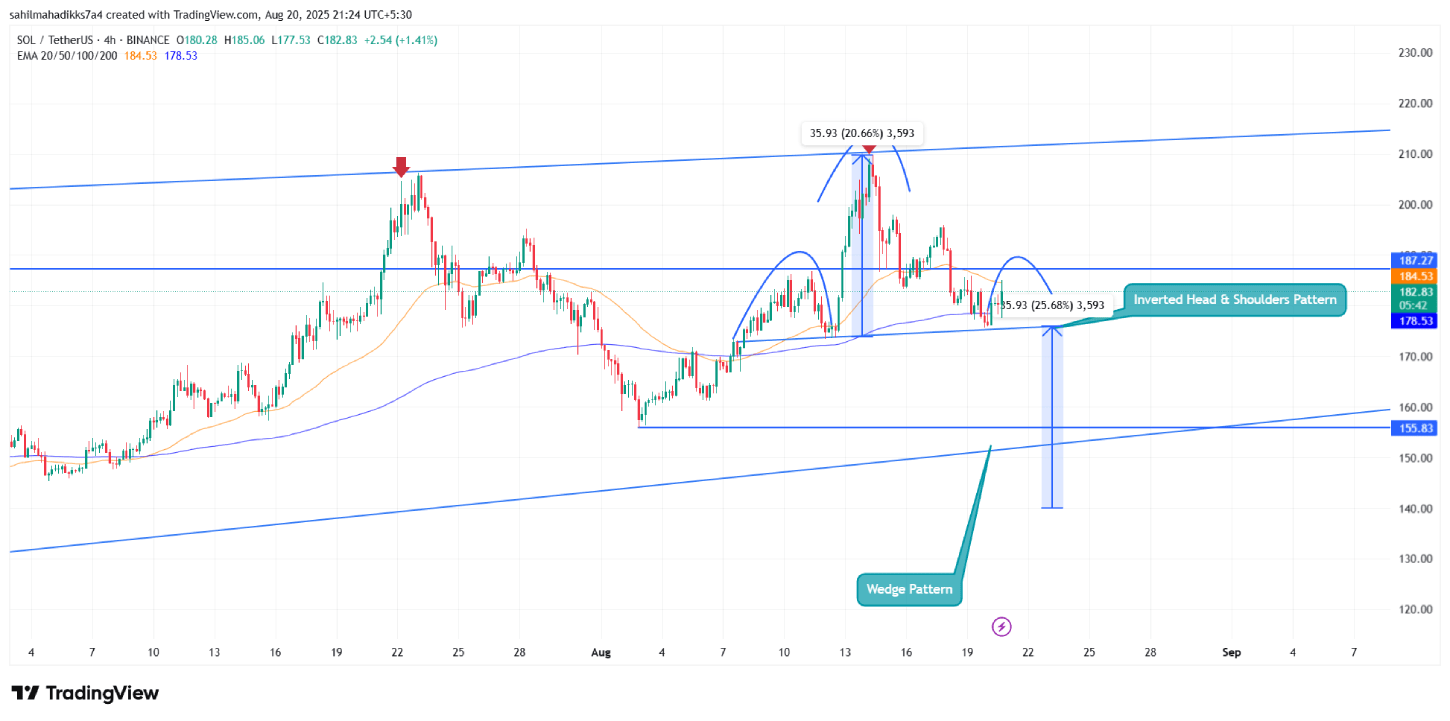
  • The Solana price is poised for a breakdown below $175 amid the formation of a head and shoulders pattern.
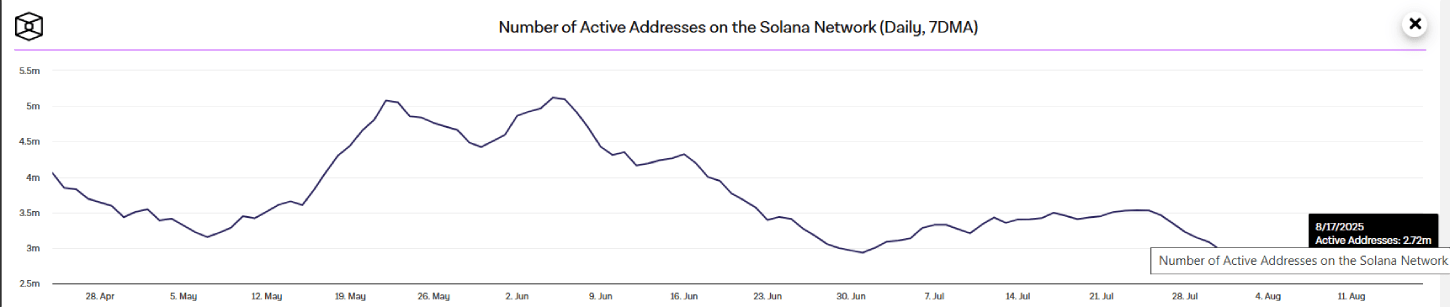
  • The number of active addresses on the network has dropped by 7% since last week, indicating a clear slowdown in user activity. 
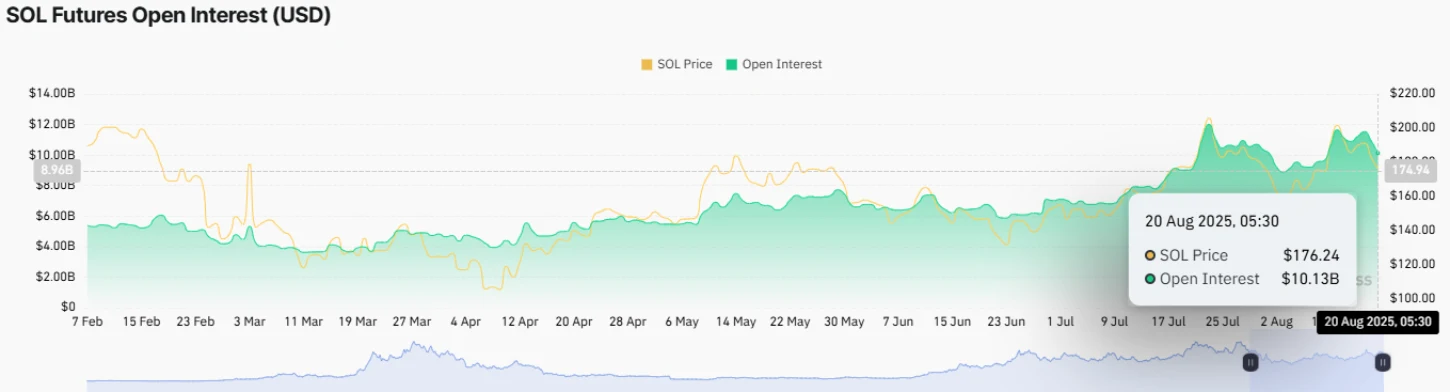
  • A declining trend in SOL’s futures open interest records a 13% amid the recent market correction, signalling a waning interest from market participants.

The Solana price shows a sharp rebound of over 4.7% during Wednesday’s U.S. market hours to trade at $184.4. The buying pressure came as a relief rally in the broader crypto market after a sharp correction since last week. The declining trend in SOL futures open interest (OI) and the number of active addresses on the network is fueling prevailing bearish momentum in price, signaling a risk of bearish breakdown ahead. The formation of a technical chart pattern in the daily chart reveals how low the coin price could plunge by August’s end.

Solana Price Declines as Network Activity and OI Decline in Tandem

Since last week, the Solana price has shown a brief correction from $209.86 to a low of $175.6, accounting for a 16.28% loss. The pullback followed a broader market correction as Bitcoin dropped below the $115,000 floor amid U.S. macroeconomic developments.

Along with price correction, the number of active addresses on Solana dives from 2.91 million to 2.72 million, projecting a 7% loss. The active addresses reflect the user’s participation on the network, including transactions and interaction with decentralized apps.

Number of Active Addresses on Solana | TheBlock

Thus, the current decline suggests that fewer users are engaging with Solana during the price pullback, pointing to reduced confidence or short-term disinterest. 

Simultaneously, SOL’s futures open interest has dropped from $11.65 billion to $10.13 billion, registering a 13% drop. A $1.52B wipeout in OI signals that traders are closing their open positions in the futures market or getting liquidated.

This often happens after a heightened volatility, where leveraged positions are forced to liquidate and overall speculative pressure is dropped.

SOL Futures Open Interest | Coinglass

The dual drop in OI and active addresses indicates that both speculative traders and network participants are stepping back. If the trend continues, the coin price could face additional bearish momentum to drive a prolonged correction.

Adding to the bearish note, a crypto whale wallet identified as ‘91GShr’ unstaked 98,291 SOL (worth approximately $17.83 million) and deposited all of it to the Binance exchange just 30 minutes after Lookonchain reported.

With a risk of a potential sell-off, a bearish bias from large investors could further fuel the market selling pressure.

Solana Price Poised for Prolonged Correction from this Reversal Pattern

On the daily chart, SOL’s latest price rebound emerged from the $117.5 neckline support of an inverted head-and-shoulders pattern. The chart setup is characterized by three successive troughs, with the middle one extended high and two short swings.

Currently trading at $184, the Solana price is likely forming the final right shoulder of this pattern before the neckline breakdown. If the sellers manage to hold the asset below $187.30 resistance, the sellers could force a bearish breakdown at $175.00 support, accelerating the selling pressure.

The post-breakdown fall could push the price 11.5% down to test a key support level at $155.77. The aforementioned support coincides with a long-coming ascending trendline that has acted as dynamic support since April 2025.

The previous reversals from this support have led to price rallies ranging from 67% to 97%. Thus, the anticipated drop to $155.77 could act as a pivot point for the Solana price to change the current trend direction.

Solana Price
SOL/USDT – 1d Chart

On the contrary note, if today’s price breaks above the $187.3 resistance, the buyers could regain control over the asset for a higher rally.

Also Read: Will the SUI Price Correction Break $3 Floor?