Friday, September 4, 2026
Home Blog Page 4

SUI Price Risks 16% Drop if 200-day EMA Support Fails

SUI price
  • The falling SUI price is poised for a breakdown below the combined support of $3.25 and the 200-day exponential moving average.
  • A flattish trendline in the 100- and 200-day EMA reflecting the mid-term sideways trend.
  • The bearish swing in SUI futures open interest and total volume lock hints at waning investor confidence in the ecosystem, bolstering the risk of prolonged downfall.

SUI, the native cryptocurrency of the SUI ecosystem, shows a slight downtick of 0.18% during Tuesday’s U.S. market hours. The bearish momentum aligns with a broader market pullback as the Bitcoin price reverted just inches before the all-time high resistance of $123,236. However, the SUI faces an additional headwind, as DeFi metrics and derivative data suggest a risk of further correction. Will this altcoin break below $3.65? 

SUI Price Slips as Weak Volume and Falling TVL Signal Bearish Pressure

Over the past week, the SUI price showed a bullish rebound from $3.26 to a $4 swing high, registering a 22.46%. The buying followed a renewed recovery momentum in the broader crypto market, as Bitcoin hit a new high of $123,236.

However, the SUI price recovery was backed by a declining trend in trading volume, signaling a weak conviction from buyers. Thus, the coin price witnessed a short reversal of 9% to currently trade at $3.66. Simultaneously, the asset market cap plunged to $12.73 billion.

Despite the price volatility, the SUI futures open interest projected no major uptick and currently stands at $1.9 billion. Open interest reflects the total value of outstanding future contracts that have not yet been settled. This stagnant or declining trend in OI value shows traders are cautious about a new position or exiting their existing one amid market uncertainty.
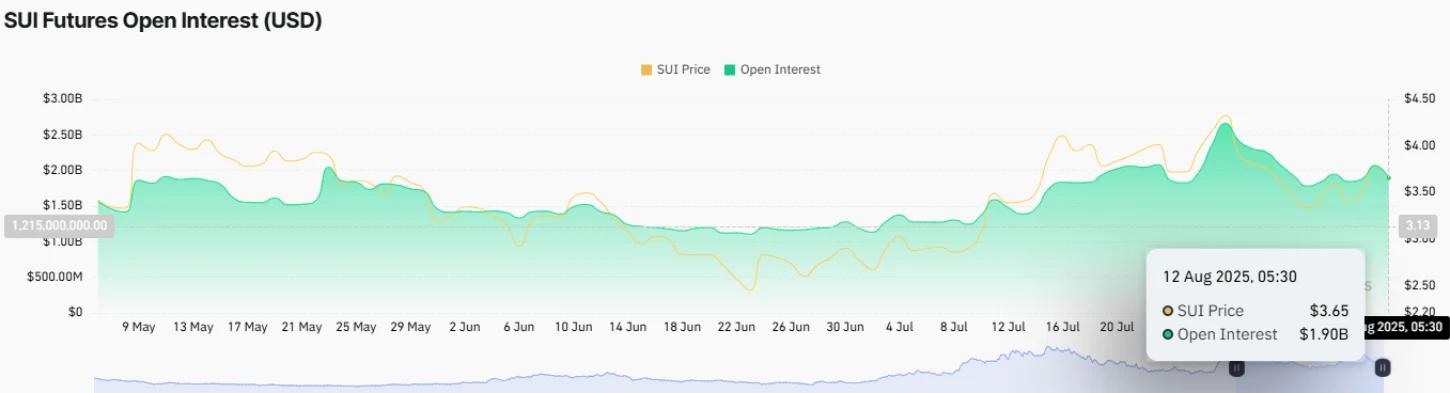
SUI Futures Open Interest | Coinglass

Adding to the bearish outlook, total volume locked (TVL) on the SUI network records a bearish downtick to $2.07 billion. Declining TVL can point to fewer active users participating in DeFi protocols, reducing the available liquidity in the ecosystem.
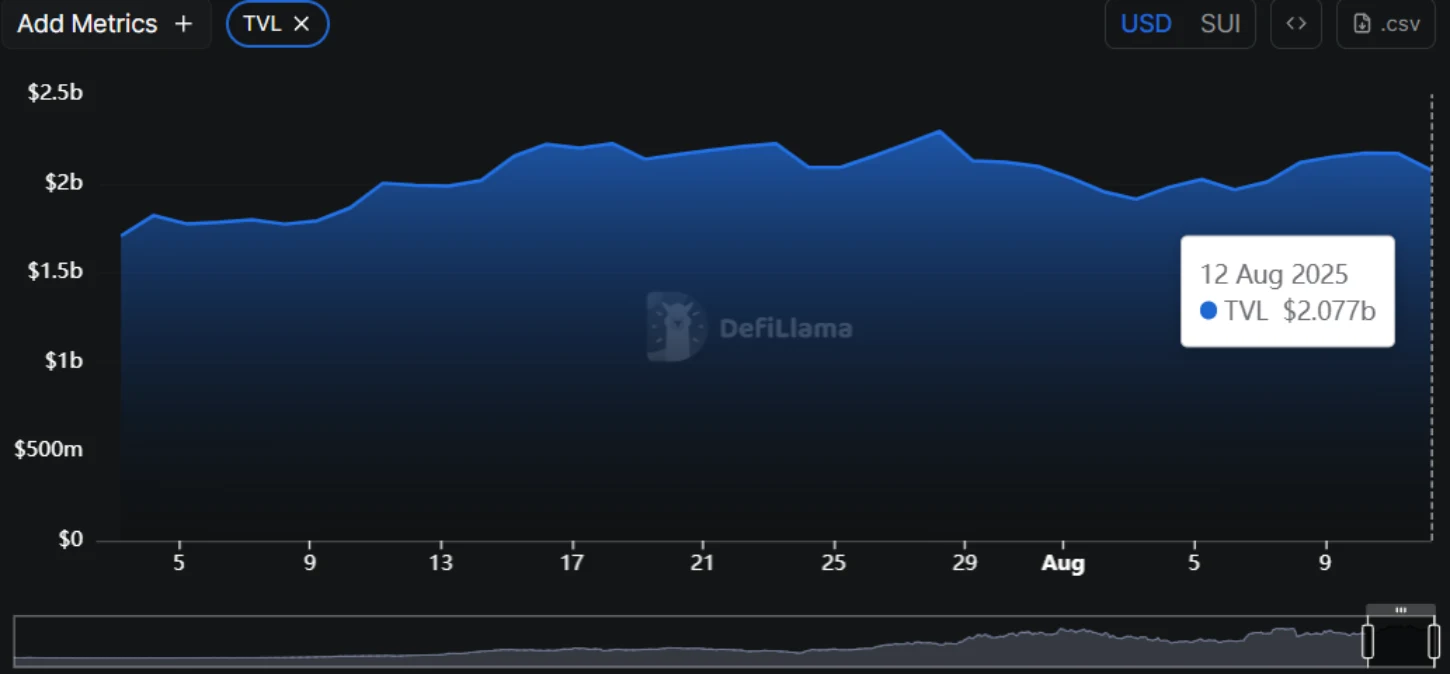
SUI total volume locked (TVL)| DefiLlama

If the trend continues, the coin price would struggle to maintain sustained momentum or push a prolonged correction in the near future.

The recent downturn in SUI price shows the formation of a new lower high in the four-hour chart, reflecting the sell-the-bounce sentiment in the market. The overhead supply could push this altcoin over 9.6% and challenge the combined support of $3.25 and the 200-day exponential moving average.

SUI Price Poised For Bearish Breakdown Within Channel Pattern

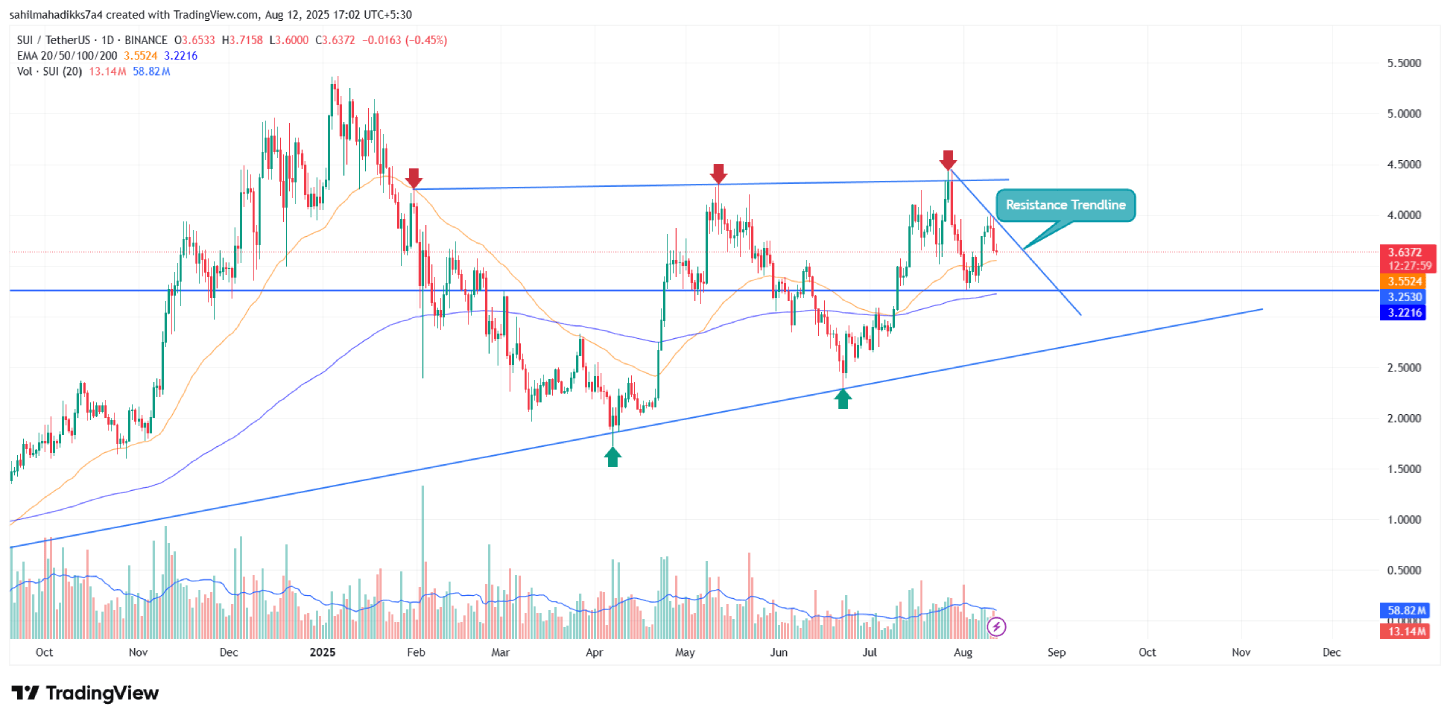
The daily chart analysis of SUI price shows a mid-term sideways trend resonating with two trendlines. Since August 2024, the coin price has received dynamic support from the ascending trendline, acting as a key accumulation zone for buyers. Meanwhile, the buyers face constant resistance at an overhead trendline intact since February 2025.

Amid the anticipated breakdown of the 200-day EMA, the coin price drove a bear cycle within the channel of two trendlines. If the breakdown closes a daily candle below, the sellers could push a 16% drop to retest the bottom trendline at $2.7.

Until the support trendline is intact, the SUI coin will hold its sideways trend and prevent a major correction.

If history repeats, the SUI price could recoup the bullish momentum at the bottom trendline for its next leap. 
SUI Price
SUI/USDT -1d Chart

On the contrary, a newly emerged downsloping trendline from the $4 is shaping the current correction in price. If the coin price manages to hold the 200-day EMA, the buyers could tease a breakout from the resistance trendline to accelerate bullish momentum for renewed recovery.


Do Kwon Expected to Pled Guilty in Terra-Luna Collapse Case

Do Kwon Expected to Pled Guilty in Terra-Luna Collapse Case

Key Highlights

  • Do Kwon is expected to change his plea, possibly admitting guilt at his Manhattan hearing
  • The court order suggests a possible plea deal, which will help them accelerate the resolution and avoid a trial originally set for January 2026
  • Kwon has already been hit with a $4.5 billion SEC penalty

Do Kwon, the 33-year-old South Korean entrepreneur once celebrated as a crypto mogul, is expected to plead guilty in one of the biggest fraud cases in digital currency history. The hearing could be the final act in a saga that saw the spectacular implosion of two cryptocurrencies, TerraUSD and Luna, wiping out around $40 billion in value and shaking global confidence in the entire sector.

Do Kwon Court

(Source: Inner City Press on X)

Court filings on Monday revealed that Do Kwon, co-founder of Singapore-based Terraform Labs, may change his plea at a hearing set for Tuesday morning in Manhattan federal court.

This is a major shift until now, as he had insisted on Do Kwon’s innocence against a sweeping list of charges, including securities fraud, wire fraud, commodities fraud, and money laundering conspiracy.

The update, first reported by Bloomberg, came in the form of a short order from the U.S. District Judge Paul Engelmayer, who noted he had been told that Do Kwon might alter his plea. 

The hearing, scheduled for 10:30 a.m. EDT, could see Kwon outline his role in the 2022 crash that erased fortunes and left thousands of investors, from retail traders to big funds, counting their losses.

Do Kwon’s Journey: Crypto Star to Lawbreaker

Kwon’s rise in the crypto world was meteoric. Through Terraform Labs, he launched TerraUSD, a so-called algorithmic stablecoin meant to stay pegged to the U.S. dollar without traditional reserves like cash or bonds. Instead, it relied on a complex system linked to its sister token, Luna, to maintain stability.

For a time, it worked, and Kwon became a star. Investors saw TerraUSD as a breakthrough in decentralized finance, and Luna’s value soared. But in May 2022, the algorithm failed. TerraUSD slipped from its $1 peg, triggering a death spiral for Luna. Within days, Luna’s price plunged to near zero.

The crash was catastrophic. Estimates suggest it vaporized $40 billion in market value. For ordinary investors, some of whom had sunk life savings into the tokens, the losses were devastating. The event also rippled across the broader crypto market, dragging down other projects and fueling calls for tougher regulation.

Flight, Arrest, and Extradition

After the collapse, Do Kwon’s image shifted from crypto visionary to fugitive. South Korean authorities issued a warrant for his arrest, accusing him of violating capital market laws. In March 2023, he was detained in Montenegro, caught trying to board a flight with forged travel documents.

What followed was a months-long legal tug-of-war between the U.S. and South Korea over where he should face trial. Montenegro ultimately sent him to the U.S. in late 2024.

Since then, Kwon has been held in custody, staring down a nine-count criminal indictment. Prosecutors allege he misled investors and manipulated markets to artificially prop up TerraUSD and Luna.

Tuesday’s hearing could determine whether Kwon admits guilt outright or negotiates a plea deal to reduce potential prison time. Judge Engelmayer’s order made it clear that Kwon’s legal team had been instructed to review any agreement with him beforehand.

Originally, a trial was scheduled for January 2026. Prosecutors were preparing to present six terabytes of evidence, a mountain of data that could have stretched proceedings for months. A guilty plea would short-circuit that process, delivering a swifter resolution.

This criminal case follows a civil blow earlier in 2025, when the U.S. Securities and Exchange Commission (SEC) won a $4.5 billion judgment against Kwon and Terraform Labs.

The SEC accused Do Kwon of falsely promoting TerraUSD as a reliable, safe investment while being aware of its fragile design. That case carried no prison time, but the criminal charges do.

The collapse of TerraUSD and Luna remains a cautionary tale. Unlike traditional currencies, cryptocurrencies depend on technology and investor trust rather than government backing. When the system underpinning TerraUSD faltered, it didn’t just sink Luna; it sent shockwaves through the entire market.

For small investors, it was like watching a trusted bridge crumble overnight. Many had believed Kwon’s assurances that TerraUSD was safe, only to find themselves holding tokens worth a fraction of what they paid.

On X (formerly Twitter), reactions to the news of a possible guilty plea have been mixed. Some see it as long-overdue accountability, while others remain bitter, knowing no verdict will restore the billions lost.

Bitcoin Soars Above $121,000 after Dipping Below $113,000

Bitcoin Soars Above $119,000 after Dipping Below $113,00

Key Highlights:

  • BTC surges past $121,000 amid positive regulatory developments in a U.S. strategic Bitcoin reserve and heavy institutional buying.
  • Experts predict BTC could hit $200K+ this year, but short-term volatility depends on inflation data and Fed policies.
  • Big corporations now dominate BTC demand

The world’s most famous cryptocurrency, Bitcoin, just smashed past $121,000, making traders and investors excited about its future. After dipping below $113,000 on August 5, BTC bounced back strongly over the weekend, proving once more why it’s the king of crypto. 

According to some experts, this jump is thanks to big-money investors, impressive development from the regulatory side, the U.S. government BTC stash, and the fact that fewer new Bitcoins are being created every day. 

Why Did Bitcoin’s Price Shoot Up?

Just a few hours ago, BTC soared above $121,000. At the time of writing, the cryptocurrency is trading at around $121,955 with a 3.46% hike in a day, according to CoinMarketCap. It is currently holding $2.37 trillion in market capitalization.  That’s a huge leap from Wednesday’s low, when the U.S. Federal Reserve hinted it might keep interest rates high for a while. 

Normally, that kind of news would scare investors, but BTC didn’t stay down for long. Instead, it got a boost, fueled by various factors like record-breaking inflows in Bitcoin ETFs, growing demand among institutional investors, and the U.S. government’s pro-crypto stance.

Big companies and investment funds are buying BTC like never before. According to experts, nearly all the recent Bitcoin buys (97%) came from institutions like banks, hedge funds, and corporations, not regular traders. 

Even BlackRock, the world’s biggest asset manager, now holds around 739,361 BTC in its ETF.

Larry Fink, CEO of BlackRock, said that “I’m very bullish on the long-term viability of Bitcoin.”

With only 21 million Bitcoins ever to exist, and just 450 new ones mined each day, heavy demand from these big players could keep pushing prices higher.

Ray Dalio, Billionaire Investor, stated that “BTC is perceived as money, and it is limited in supply. Very easily, all around the world, you can transact with it.”

What Do the Experts Say?

Some analysts believe BTC could surge significantly higher this year, potentially reaching $200,000 or more. 

Matt Hougan from Bitwise believes that with more institutions jumping in and the U.S. economy looking shaky, BTC could double in price. Cathie Wood, a well-known investor, still thinks Bitcoin could hit $1 million in the next five years.

But not everyone agrees. A few early Bitcoin BTC are selling, worried that big banks and corporations are taking over what was meant to be a “people’s currency.” Others, like trader Scott Melker, say this is just part of Bitcoin growing up as more big investors mean more stability, even if it changes Bitcoin’s original rebel spirit.

For now, traders are watching two key price levels: if BTC stays above $117,900, it could race toward its all-time high of $123,000. But if it falls below $116,800, a drop to $110,000 might be next.

Jack Dorsey, Former Twitter CEO, recently stated that“Bitcoin will make the current financial system feel as irrelevant as the fax machine.”

The next big moment for BTC could come when the U.S. releases new inflation data. If inflation is lower than expected, Bitcoin might shoot toward $130,000. But if inflation stays high, prices could dip. Long-term, though, most experts stay bullish. Some predict BTC could swing between $99,000 and $260,000 this year, depending on how much money keeps flowing in from big investors.

Earlier, Strategy’s Michael Saylor affirmed that BTC will make the current financial system feel as irrelevant as the fax machine. Its decentralized nature ensures it cannot be shut down, offering ultimate freedom to users.

However, for BTC to reach its full potential, it must evolve beyond being just a store of value. It needs to be used for everyday payments to maintain relevance and drive mass adoption. The focus should be on building infrastructure that makes BTC a practical currency for daily transactions, not just an investment asset.

Bitcoin Price Breaks Bullish Flag as Retail and Whale Buying Tightens Supply

Bitcoin
Bitcoin Price Analysis
  • Bitcoin price broke out from the key resistance of a flag pattern, signaling the continuation of the prevailing recovery.
  • A multi-tiered demand pressure from BTC’s retail investors and large-scale investors could create a significant supply squeeze in the market.
  • The BTC price is back above the fast-moving exponential moving averages of 20 and 50, indicating the near-term trend is strengthening. 

The pioneer cryptocurrency, Bitcoin, takes a short dive of -0.46% during Friday’s U.S. market hours to currently trade at $116,970. Despite the intraday sell-off, the daily candle highlights a long-tailed rejecting candle, indicating an intact demand pressure in the market. This buying pressure can be attributed to multi-tiered demand from retail investors and crypto whales, notably outpacing new BTC issuance from miners. Is Bitcoin price poised to hit a new high in August?

Shrimp-to-Fish and Whales Unite in Aggressive Bitcoin Buying Spree

Since last weekend, the Bitcoin price has shown a brief rebound from $111,919 to the current trading value of $116,923, projecting a 5.13% surge. The buying pressure followed the regulatory developments in the United States as the president signed executive orders to allow crypto in 401(k)s and stop banking discrimination against digital assets.

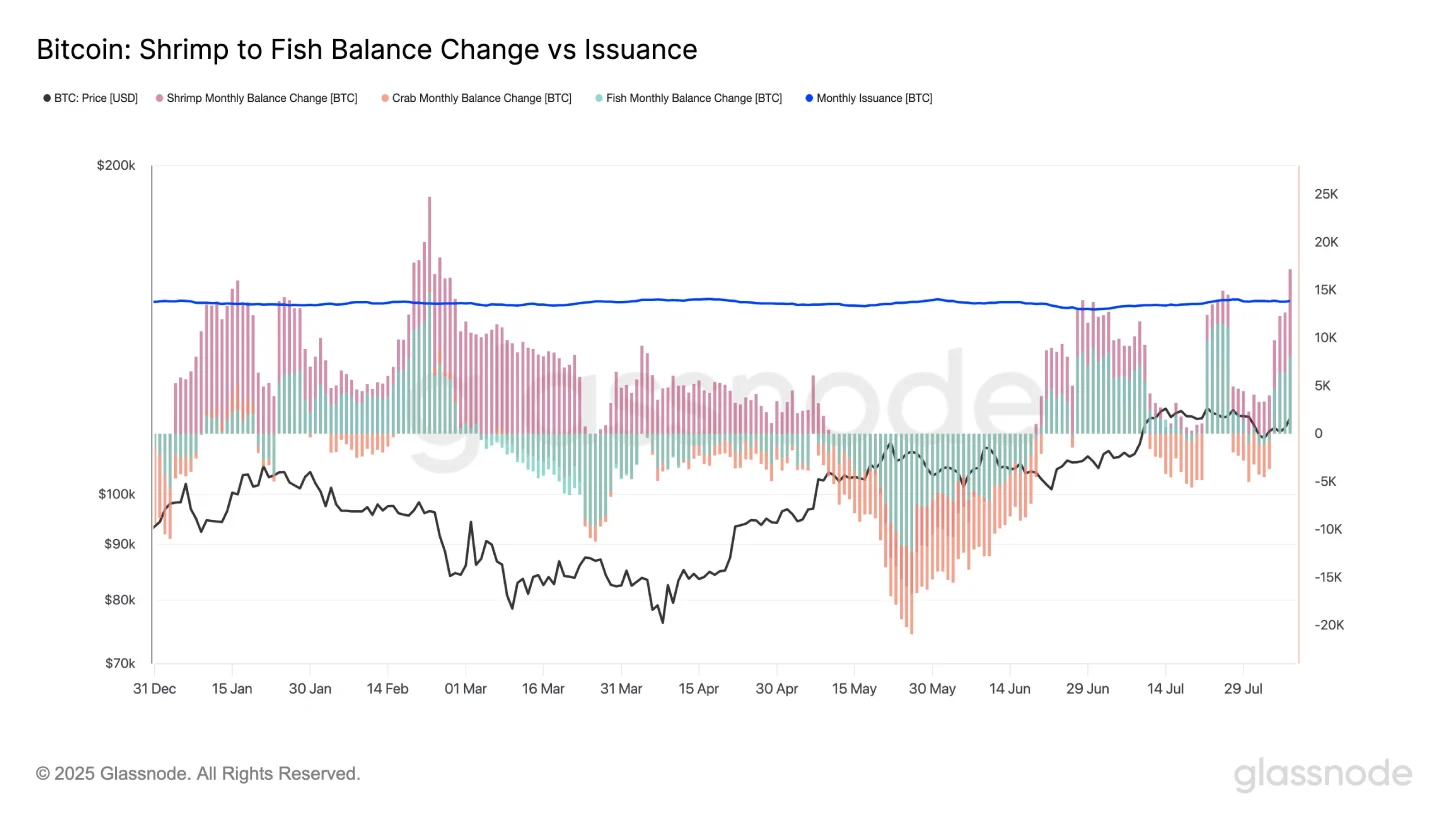
However, the coin price gained additional momentum as BTC’s small holders—dubbed as “Shrimp-to-Fish” cohorts or wallets with less than 100 BTC—are quietly absorbing the available supply at a pace that exceeds the new issuance.

According to the analytical platform Glassnode, these retail-driven addresses are maintaining a monthly balance growth of above 17,000 BTC, which is outpacing the +13.85K BTC created through mining.

Notably, the shrimps (wallets with less than 1 BTC) are adding nearly 10K BTC, underscoring a persistent demand from retail investors. Despite the recent price volatility, the retail conviction remains strong, and therefore, continued accumulation from these wallets could put upward pressure on the price over time.

Bitcoin Shrimp-to-Fish cohorts

Adding to the bullish note, the high-net-worth investors are also tightening their grip on the BTC supply. According to blockchain tracker Lookonchain, a newly created wallet, 175k5C, withdrew 100 BTC (worth approximately $11.71 million) from the Binance exchange just an hour before reporting.

While another whale, bc1qgf, received 263 BTC (worth $30.82 million) from FalconX to boost its current holding to 891.5 BTC worth $104 million.

This multi-layered demand from retailers and large-scale investors could create a significant supply squeeze in the market, bolstering the Bitcoin price for a higher rally.

BTC Price Teases Breakout from Bullish Flag Pattern

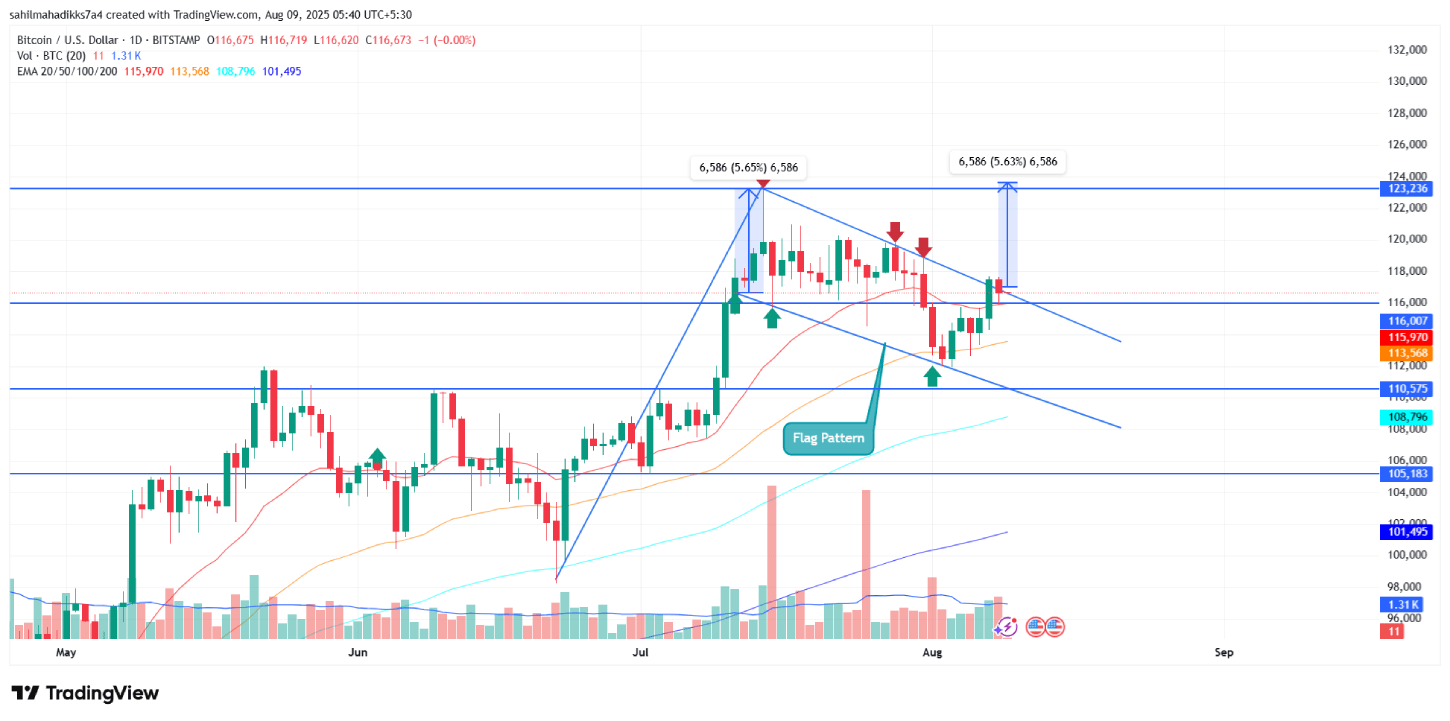
The daily chart analysis of the Bitcoin price shows its recent correction resonated within two downsloping trendlines of a bull flag pattern. The chart setup is commonly spotted in an established uptrend where its long ascending pole projects the dominant uptrend and a temporary pullback to regain bullish momentum. 

On August 7, the BTC price gave a bullish breakout from the pattern resistance trendline, signalling the continuation of the prevailing recovery. With today’s downtick, the price shows a post-breakout pullback to the breached trendline, validating its suitability for a higher rally.

A long lower wick on Bitcoin’s daily candle highlights sustained demand pressure, signaling strong buyer support. This momentum could fuel a 5.63% rally, positioning BTC to retest its all-time high resistance at $123,233.

If the pattern holds true, the Bitcoin price could drive an extension towards the $137,000 mark. 

Ethereum Price
ETH/USDT – 1d Chart

However, if the retest candle enters the flag range, the sellers could try to regain their control over this asset for another correction push.

Also Read: XRP Surges as Ripple and SEC End Legal Battle with Joint Appeal Dismissal

XRP Surges as Ripple and SEC End Legal Battle with Joint Appeal Dismissal

XRP Price Analysis
  • XRP shows a healthy retracement to the 38.2% Fibonacci retracement level to recoup its exhausted bullish momentum.
  • The U.S. SEC and Ripple Labs finally ended its 5-year-long lawsuit after filling a joint dismissal of appeal, dated August 7th, 2025
  • The declining trend in XRP’s open interest and an anticipated dive of the funding rate into the negative region indicate a weakening bullish momentum.

XRP, the native token of the XRP Ledger, witnessed a sharp 9.68% surge during Thursday’s U.S. market hours to trade at $3.277. The bullish momentum followed the broader market uptick after Donald Trump signed executive orders to allow crypto in 401(k)s and stop banking discrimination against digital assets. However, the coin price gained additional momentum as a five-year-long legal battle between the U.S. Securities and Exchange Commission and Ripple Labs have officially come to a close. Is XRP price ready for a $4 breakout?

SEC and Ripple End Legal Battle with Joint Dismissal of Appeals

Since last weekend, the cryptocurrency market has successfully pushed back against the dominant bearish momentum, with most major assets, including XRP, witnessing renewed recovery. The bullish upswing has bolstered the XRP price from $2.728 to the current trading price of $3.32, projecting a 22% growth.
A substantial portion of this recovery is recorded today as the price bounced 11% and teases an upside breakout from the $3.3 horizontal resistance. Subsequently, the asset’s market cap has bounced to $197.26 billion, while the 24-hour trading volume is up 53% to reach $7.3 billion.

The buying pressure can be attributed to a new court filing dated August 7, showing that the U.S. SEC and Ripple Labs have filed a joint dismissal of appeal, effectively ending a five-year-long legal battle. With this move, all pending appeals have been withdrawn, and one of the most closely watched crypto lawsuits in U.S. history is legally over.

With the case closed, XRP is potentially positioned for clearer institutional adoption in the U.S. market. Ripple may also resume or expand its U.S.-based operations without the overhead of regulatory scrutiny. Meanwhile, the SEC could recalibrate its approach to crypto enforcement, particularly under Donald Trump’s pro-crypto stance.

These developments could bolster the native cryptocurrency XRP to regain bullish momentum and drive a high rally.

XRP Price Challenges Key Resistance For Continued Recovery

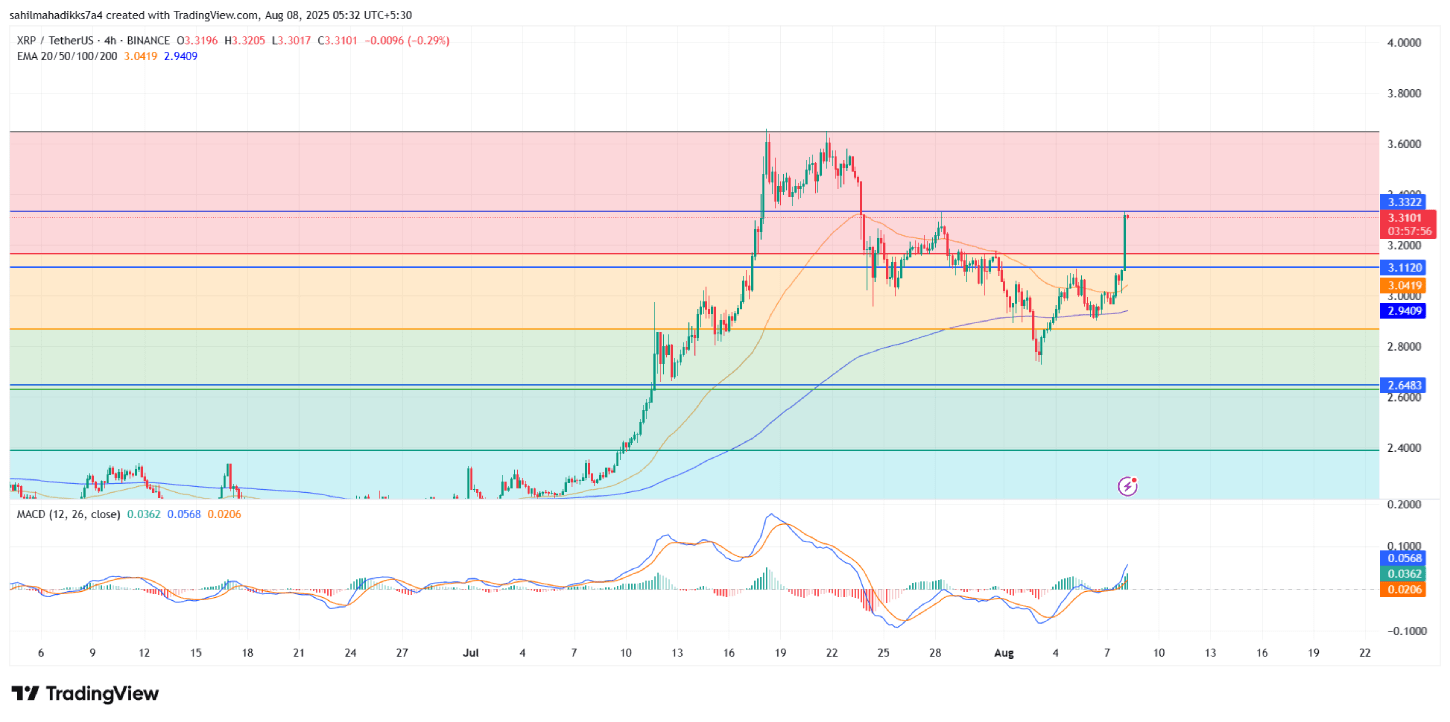
The daily chart analysis of XRP price shows its recent correction trend bounced from the 50-day exponential moving average (EMA) and the 38.2% FIB level. Historically, this level has acted as a suitable pullback support for buyers to recuperate their exhausted bullish momentum. 

A potential bullish crossover between the MACD and signal line would project the rising bullish momentum and a change in the short-term price trend. 

With today’s price surge, the coin price teases a bullish breakout from a notable lower-high formation in XRP’s 4-hour chart. A potential breakout with the 4H candle closing will signal a change in the bullish shift in market sentiment and push the price to another 7.95% surge to challenge the last swing high of $3.75.

XRP Price
XRP/USDT -1d Chart

On the contrary, if the sellers continue to defend the $3.33 barrier, the buyers could drive the price lower with a fresh lower high formation in the 4-hour chart. A series of such lower-high formations is often spotted in an established downtrend, as market participants follow a sell-the-bounce sentiment.

If materialized, the potential downturn could seek suitable pullback support at $3.11, $2.90, and $2.64.

Also Read: China to Allow Launch of Its First Crypto Stablecoin amid Crypto Ban Rumors

China to Allow Launch of Its First Crypto Stablecoin amid Crypto Ban Rumors

China to Permit Launch of Its First Crypto Stablecoin amid Crypto Ban Rumors

Key Highlights

  • According to the latest report, China is preparing to launch its first Yuan-backed stablecoin through Hong Kong
  • The launch is expected to boost the renminbi’s global reach and counter USD dominance
  • Recently, there has been buzz on the internet claiming that China will ban cryptocurrencies

Amid the regulatory shift in the US for the cryptocurrency market, Beijing is preparing to greenlight its first government-backed stablecoin, which is a digital currency pegged to the Chinese yuan (CNY). This comes despite persistent rumors of an expanded crypto ban.

According to the latest report, China’s central bank, the People’s Bank of China (PBOC), is working closely with Hong Kong regulators to introduce a regulated stablecoin framework. The purpose behind this development is to boost the yuan’s global appeal and counter the dominance of U.S. dollar-backed stablecoins like Tether (USDT) and USD Coin (USDC).

Hong Kong, which operates under a separate financial system from mainland China, has already laid the groundwork. On August 1, 2025, the city’s new Stablecoins Ordinance took effect, allowing licensed firms to issue fiat-backed digital tokens. 

Now, Beijing appears ready to leverage this framework to push forward with a renminbi-pegged stablecoin. This is a digital asset designed to facilitate cross-border trade while keeping capital controls intact

Why Now? The U.S. Stablecoin Surge and China’s Fear of Falling Behind

The decision comes as the U.S. accelerates its own crypto adoption. In July, President Donald Trump signed the GENIUS Act, establishing the first federal regulatory framework for dollar-pegged stablecoins. 

Analysts say this has put pressure on China to act in fear of losing influence in the evolving digital finance landscape.

“The U.S. is going all-in on crypto, and China doesn’t want to be left behind,” said Zhiguo He, a finance professor at Stanford University. “There’s a real fear of missing out.”

That fear is justified. Over 99% of stablecoins today are dollar-denominated, reinforcing the greenback’s dominance in global trade. Meanwhile, the yuan’s share in international payments has slipped to just 2.89%, its lowest in nearly two years.

A yuan-backed stablecoin could change that. By enabling faster, cheaper cross-border transactions, China hopes to make the renminbi more attractive to businesses—especially those wary of U.S. sanctions or dollar volatility.

The Hong Kong Experiment with Stablecoin: A Controlled Gateway for Crypto

Unlike Bitcoin or Ethereum, which remain banned in mainland China, stablecoins offer Beijing a way to embrace blockchain innovation without relinquishing control.

Hong Kong is set to be the testing ground. Major Chinese firms, including JD.com and Ant Group, have already applied for stablecoin licenses under the city’s new rules. Their proposal? A digital token backed by the offshore yuan (CNH), which circulates freely outside China’s strict capital controls.

“An offshore yuan stablecoin could serve as a bridge between China and global markets,” said Wang Yongli, former vice president of the Bank of China. “It’s a way to modernize payments without destabilizing the domestic financial system.”

Still, challenges remain. Competing with the entrenched dollar stablecoin ecosystem won’t be easy. As Chen Lin, director of the Centre for Financial Innovation and Development at the University of Hong Kong, put it: “Hong Kong is making efforts, but there’s still a long way to go.”

Crypto Ban Rumors

While China moves forward with its stablecoin plans, rumors of a total crypto ban have resurfaced. Social media posts in May claimed Beijing would criminalize even private crypto ownership, sending Bitcoin briefly below $105,000.

But experts say these fears are overblown. No official PBOC statement has confirmed a new ban, and analysts believe the reports recycle old news from China’s 2021 crackdown.

Instead, Beijing’s focus appears to be on state-controlled digital assets—like the digital yuan (e-CNY), which has processed over 7 trillion yuan ($977 billion) in transactions since its 2020 pilot launch.

“China isn’t banning crypto because it hates blockchain,” said Li Yang, a top economist at the Chinese Academy of Social Sciences. “It’s about control. The goal is to integrate stablecoins and CBDCs in a way that serves national interests.” 

For now, China is taking a measured approach. Only one of the country’s four major state-owned banks is expected to receive an initial stablecoin license, with trials likely limited to business-to-business transactions.

The PBOC has also hinted that this does not mean a broader crypto legalization. Mainland restrictions on Bitcoin and Ethereum remain firmly in place.

Ethereum Price Faces $68M Whale Dump as Bearish Flag Looms

  • Ethereum price recovery is poised to challenge a key resistance level at $3,740 amidst the formation of a flag pattern.
  • ETH’s net taker volume plunged into the negative region, indicating the aggressive selling pressure in the market.
  • Lookonchain data reveals that whale crypto wallets have transferred a million dollars’ worth of Ethereum to crypto exchanges.

ETH, the native cryptocurrency of the smart contract giant Ethereum, records a 1.75% jump during the U.S. market hours. With the intraday surge, the Ethereum price is likely to challenge a key resistance zone at $3,740, signaling a pivot level for the asset to determine its next move. However, the on-chain data highlights that whales and retail traders are rushing to exit the market, reinforcing the selling pressure in price. Is a breakdown below $3,500 looming?

Negative Net Taker Volume and Whale Selling Suggest Deeper ETH Correction 

In the last two weeks, the Ethereum price has shown a brief correction from $3,940 to the current trading price of $3,684, projecting a 6.5% loss. The pullback initiated with broader market sentiment for a post-rally correction, but bears gained additional momentum amid the aggressive selling pressure from market participants.

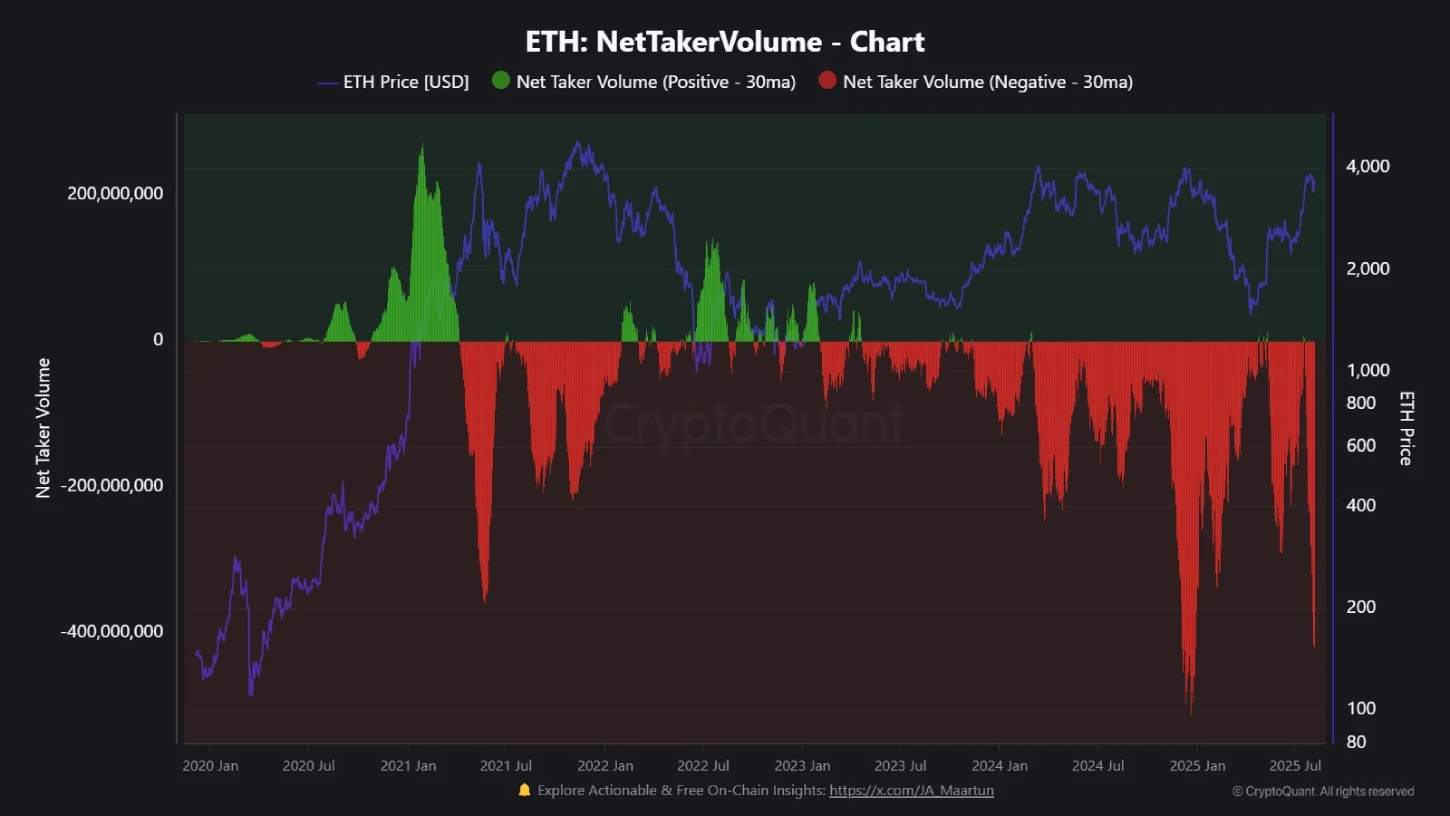
In a recent post, market analyst Maartunn highlighted that ETH’s net taker volume has dived deep into negative territory, currently sitting at -$418.8 million. This metric highlights the disparity between aggressive buyers and sellers in the market, who prefer quick market orders over waiting for limit orders. 

When net taker volume skews negative, it indicates that sellers are currently the aggressive force in markets, typically a precursor for a a potential downturn. According to CryptoQuant data, the taker sellers have offloaded 104.3k more ETH coins than the buyers are willing to absorb.

Net Taker Volume | CryptoQuant

The sharp disparity suggests that the participants are prioritizing the speed of execution over the suitable price exit, subtly resembling panic selling. If the trend persists, Ethereum’s short-term outlook would continue to remain under pressure as sellers’ influence dominates.

Adding to the bearish note, the blockchain tracker LookonChain reveals a notable selling pressure from high-net-worth investors in today’s market.

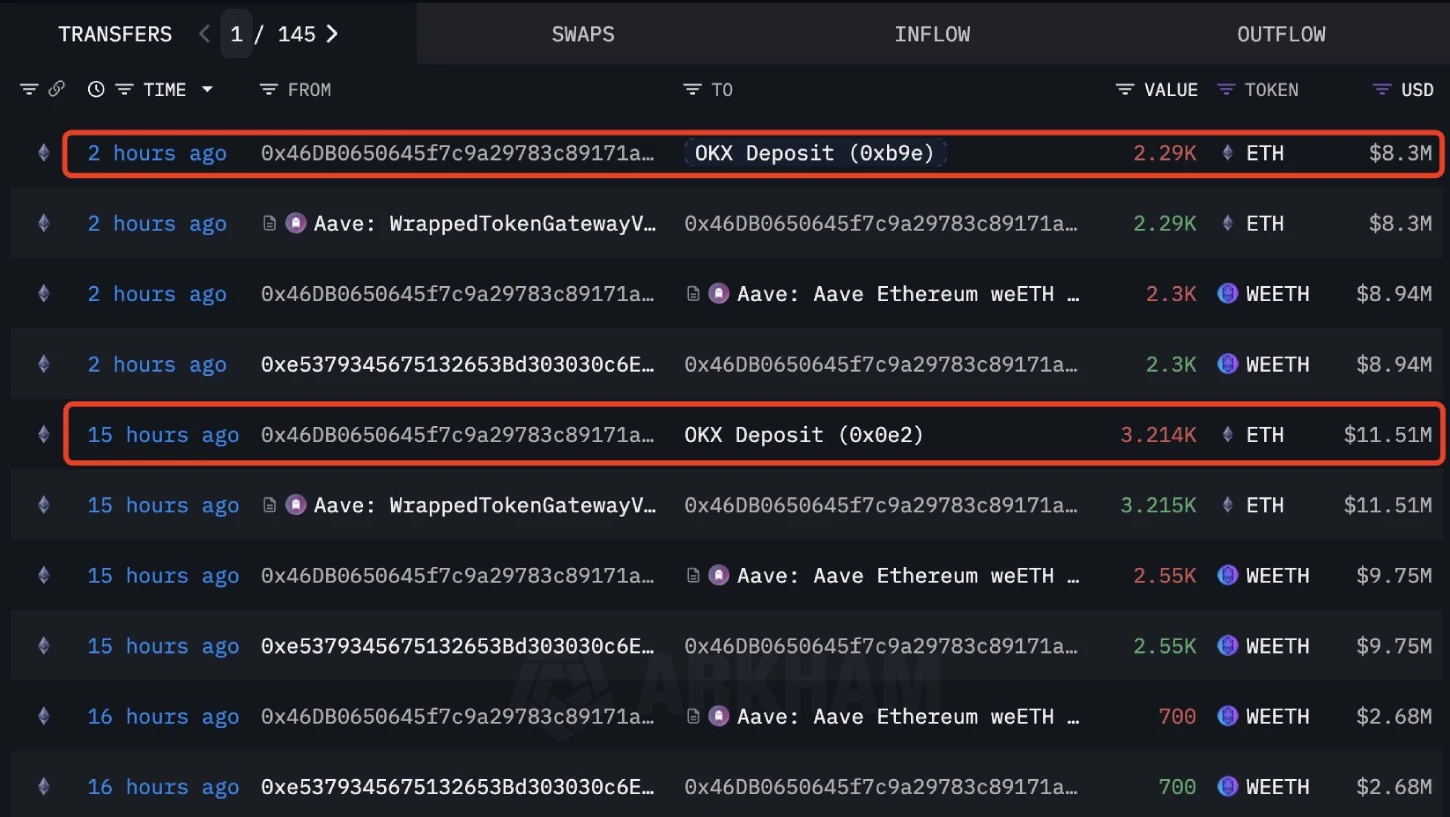
Earlier today, a crypto whale wallet, 0x46DB, deposited 5,504 ETH, valued at around $19.89 million, to the OKX exchange.

Whale Activity | Lookonchain

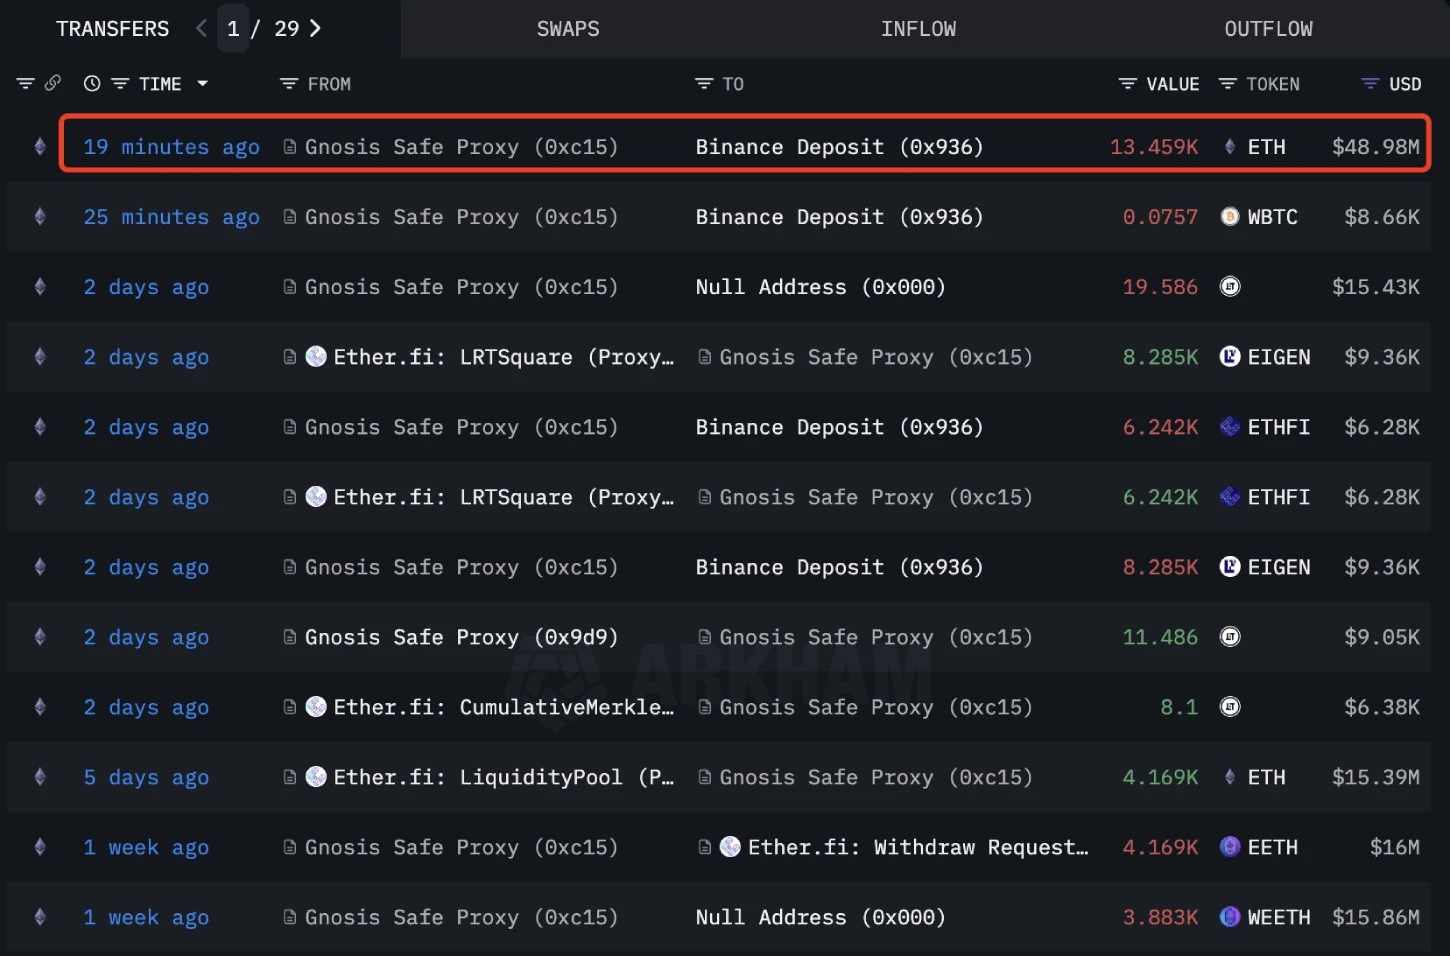
In addition, another wallet, 0xc156, deposited 13,459 ETH (worth approximately $49 million) to the Binance exchange just 20 minutes before reporting.

Whale Activity | lookonchain

Historically, a distribution phase from crypto whales has often been accompanied by a major market correction and continues to correct in price.

Also Read: MetaMask, Stripe Prepares to Launch Stablecoin “mmUSD”

Ethereum Price Stands at a Pivot Level of a Flag Pattern

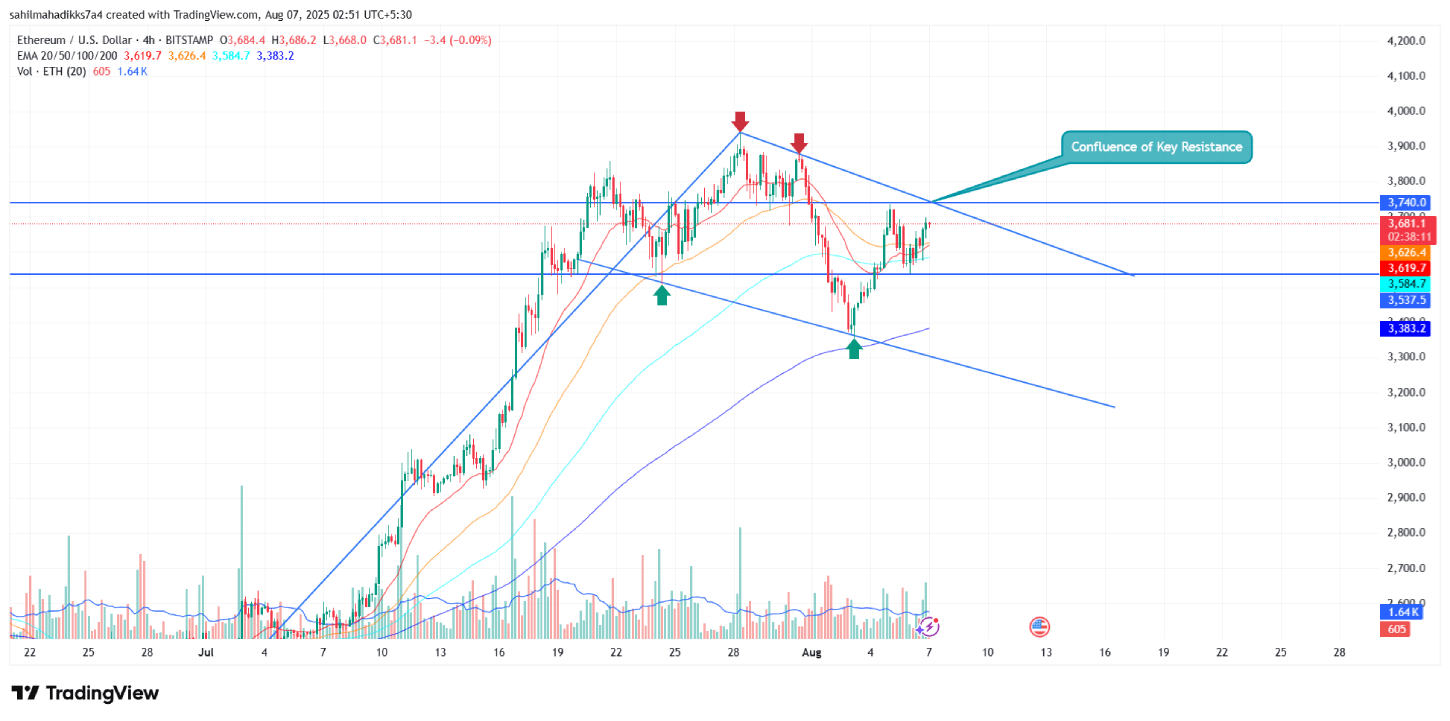
The ongoing correction trend in Ethereum price has found a temporary bottom at the $3,365 level before driving a sharp reversal. The bullish upswing pushed 9.3% up in the last 4 days to currently trade at $3,673. If the renewed recovery persists, the buyers could challenge a key confluence of horizontal resistance level and downsloping trendline of the flag pattern at $3,740. 

A potential breakout below this barrier would accelerate the market momentum and boost the price for an initial surge towards $4,150. 

Ethereum price
ETH/USDT -1d Chart

On the contrary, the current market uncertainty and mounting selling pressure from whales and retail traders signal the risk of a potential reversal. If the coin price displays a renewed selling pressure at $3,740, the sellers could push for a prolonged downtrend below $3,537 and $3,365 support.

Also Read: Solana Price Signals 7% More Pain as Bulls Lose Control of Key Support

Solana Price Signals 7% More Pain as Bulls Lose Control of Key Support

Solana Price
  • The Solana price rides a midterm recovery trend within a rising wedge pattern.
  • The number of active addresses on the network has declined by 18% over two weeks, indicating a clear slowdown in user engagement. 
  • The SOL price breakdown below the 200-day EMA slope signals a potential 7% decline in the near future.

SOL, the native cryptocurrency of the Solana network, plunged over 3.87% during the U.S. market session and traded at $1.65. The bearish pullback has nearly evaporated the entire Monday market gain of this altcoin, signaling the continuation of the prevailing correction. The declining trend in the number of active addresses on the network and the open interest derivative market further reinforces the bearish momentum in price. Is the SOL coin heading below $150?

Solana Price Breaks Below Crucial $165 Support Amid User Activity Slump 

In the past two weeks, the Solana price showcased a significant correction from $205.75 to the current trading price of $162.28, registering a 21.13% loss. Initially, the selling pressure came as a post-rally correction in the broader market but gained additional bearish momentum amid the notable decline in the number of active addresses on the SOL network.

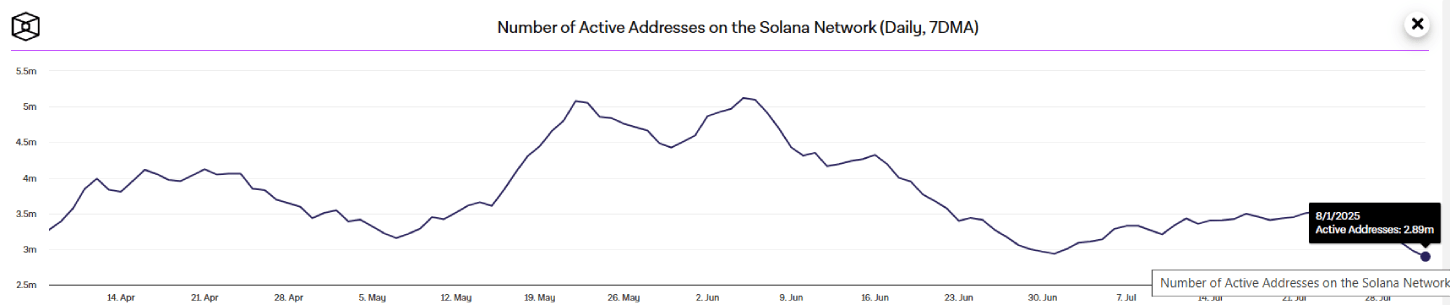
According to TheBlock data, the active addresses on Solana have dived sharply from 3.53 million to 2.89 million, now registering an 18.1% loss.

This decline suggests a notable slowdown in user engagement and transaction throughput in the Solana network. The drop can be attributed to risk-off sentiment in the market, resulting in decreased DeFi activity. If the trend continues, Solana’s network momentum may face a short-term setback, potentially limiting its price recovery prospects.

Active Addresses on Solana | TheBlock

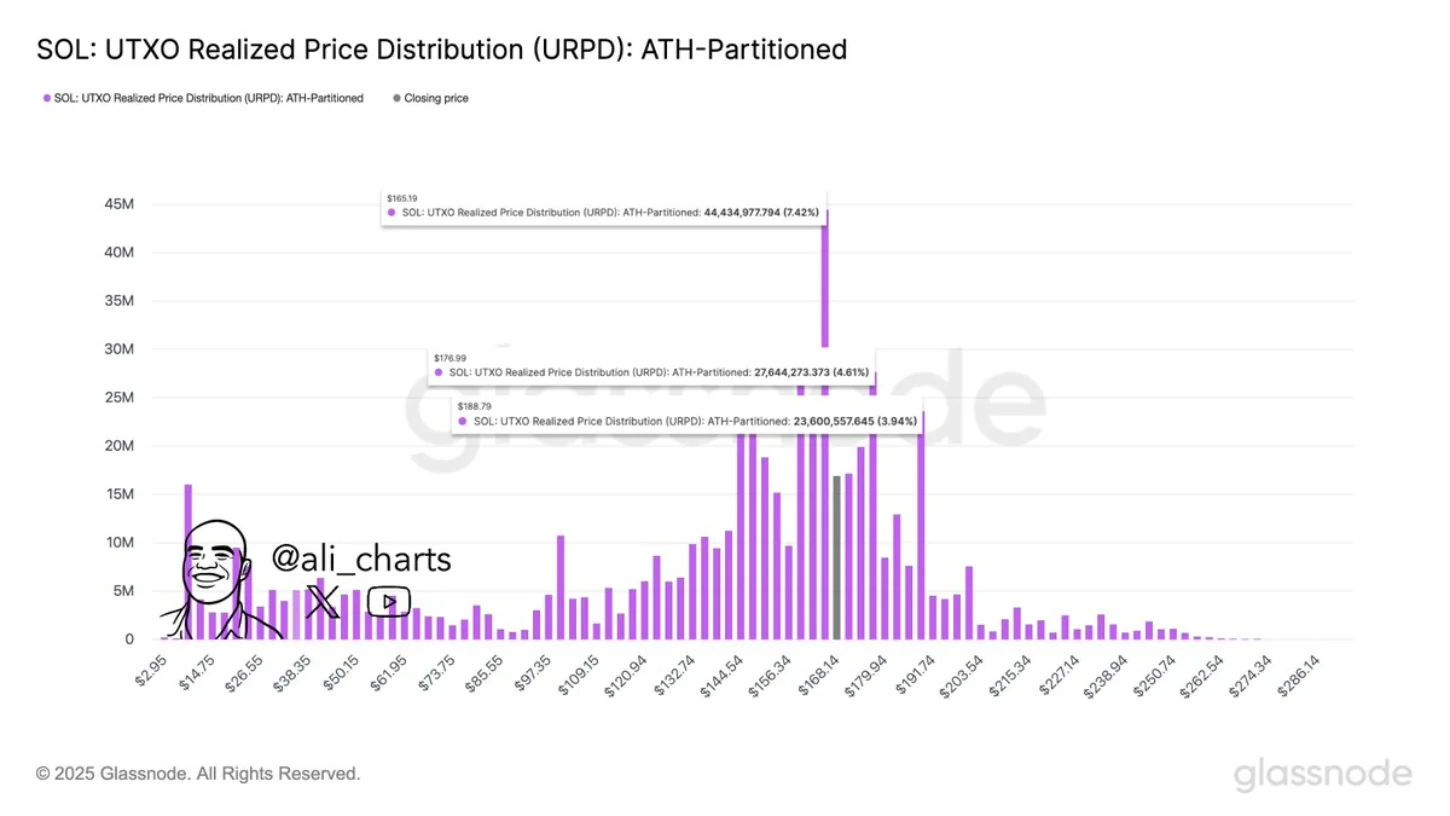
Additionally, a recent tweet from market analyst Ali Martinez highlighted that the $165 level stands as a crucial support level for Solana price with potential resistance levels at $177 and $189. According to the UTOX realized distribution data (URPD), over 44.4 million Solana tokens, i.e., 7.42% of the current supply, were acquired near the $165 level, marking its area of interest for traders.

UTOX realized distribution data (URPD) | Glassnode

However, with the intraday sell-off, the coin price breaks below the $165 support to currently peak at the $162 mark. This bearish breakdown flips a strong demand zone into a potential resistance, reinforcing the risk of further correction.

As the market uncertainty persists, a potential uptick to $165 could allow the mass volume of holders to sell their coins at breakeven, notably accelerating the market selling pressure.

Also Read: Bitcoin Demand Remains Resilient Amid Price Volatility; $125K BTC Soon?

SOL Drive Prolonged Correction With Wedge Pattern

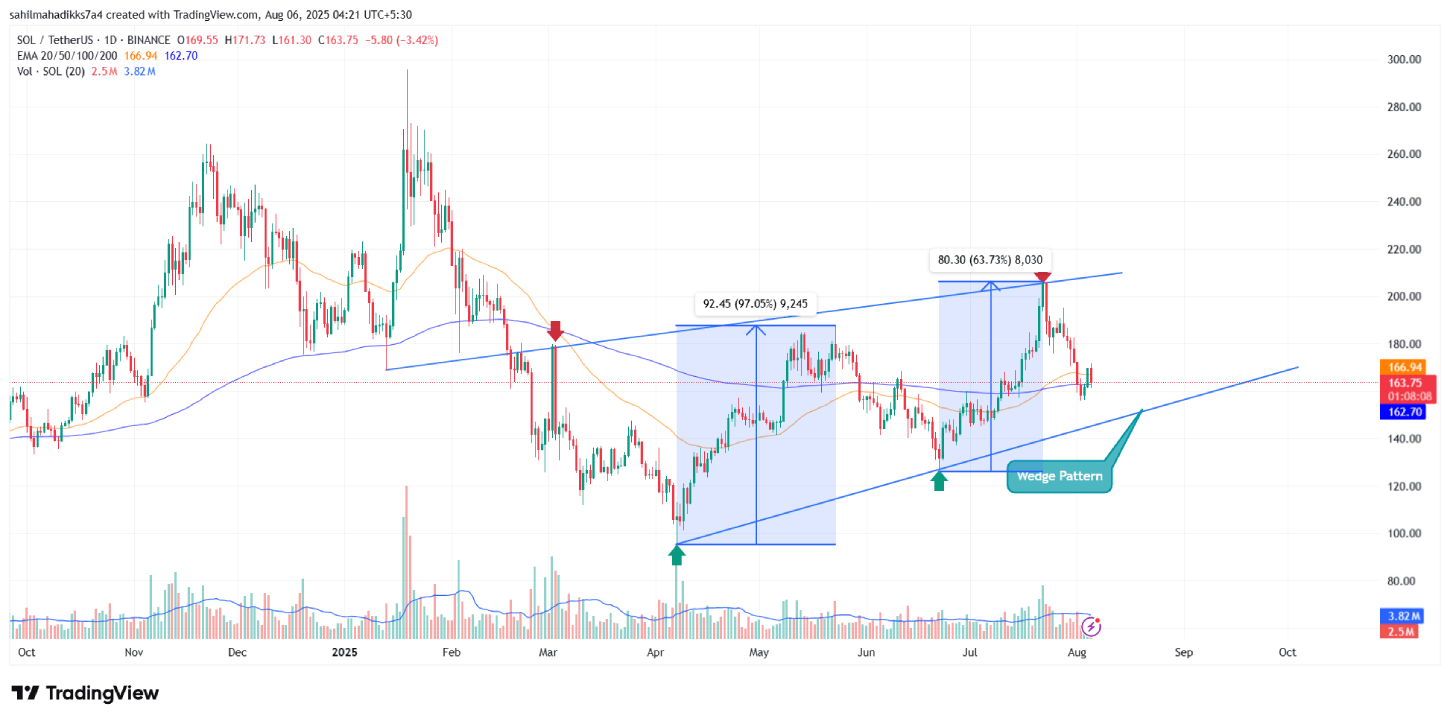
The daily chart analysis of Solana price shows a V-top reversal from the resistance trend line of a rising wedge pattern. Since March 2025, the coin price has been resonating between the two converging trendlines of the pattern as it drives a steady mid-term uptrend in price. 

Currently, the falling SOL price teases a breakdown below the 200-day Exponential Moving Average— a level that offers a general sentiment in the market for an asset.

If the breakdown sustains, the sellers could push another 7% drop to hit the pattern’s lower boundary at the $150 mark.

Solana Price
SOL/USDT – 1d chart

Having said that, the bottom support trendline has acted as a strong accumulation zone for buyers to recoup the bullish momentum. Historically, a reversal from this support has bolstered a recovery trend, offering a growth within a range of 63% to 97%.

Until the price breaks below the lower trendline of the wedge pattern, the coin price could hold its broader bullish trend.

Also Read: MetaMask, Stripe Prepares to Launch Stablecoin “mmUSD”

MetaMask, Stripe Prepares to Launch Stablecoin “mmUSD”

MetaMask, Stripe Prepares to Launch Stablecoin "mmUSD"

Key Highlights

  • MetaMask prepares to launch mmUSD stablecoin, according to the latest governance proposal 
  • mmUSD will be processed through Stripe’s financial infrastructure and M^0 network
  • If approved, stablecoin will be added to Aave v3’s lending markets on Ethereum and Linea. 

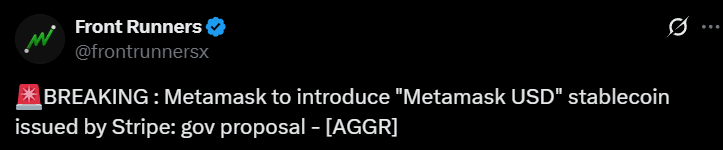
MetaMask, the popular Ethereum wallet with more than 30 million users, is reportedly preparing to launch its own stablecoin, MetaMask USD (mmUSD), in partnership with payments giant Stripe, according to the latest governance proposal. 

MetaMask USD (mmUSD)

(Source: Front Runners)

MetaMask’s move is a major push into the $251 billion stablecoin market, to make crypto transactions faster, cheaper, and more accessible.

The proposal, authored by DeFi research firm TokenLogic, shows mmUSD’s potential to become a core liquidity asset across MetaMask’s ecosystem, including its wallet, swap service, and DeFi integration. It will be added to Aave v3’s lending markets on Ethereum and Linea. 

mmUSD will be issued through Stripe’s M^0 network, a regulated platform for on-chain dollar settlements. This will ensure compliance and stability.

Designed as a neutral, high-liquidity base currency, mmUSD is planning to streamline transactions in MetaMask’s products while deepening stablecoin liquidity in DeFi.

If approved, users could supply or borrow mmUSD on Aave v3.

Stripe’s Role in mmUSD’s Stability

Unlike most stablecoins issued by crypto-native firms, mmUSD will be processed through Stripe’s financial infrastructure. This partnership will ensure smoother conversions between fiat and crypto. 

Stripe’s involvement is a game-changer as its global payment rails could reduce transaction costs and settlement times, making mmUSD a practical option for everyday spending, remittances, and DeFi transactions.

The stablecoin will be pegged 1:1 to the U.S. dollar, similar to USDC and USDT, but with the added advantage of MetaMask’s deep integration into the Ethereum ecosystem. 

This could boost its rapid adoption among its existing user base while attracting newcomers wary of crypto’s volatility.

Stablecoins have become the backbone of crypto trading and decentralized finance (DeFi), acting as a bridge between traditional money and blockchain. 

MetaMask’s entry into this space could accelerate mainstream crypto adoption, especially as regulatory clarity improves.

In April 2025, the SEC confirmed that well-backed, dollar-pegged stablecoins are not securities, removing a major hurdle for projects like mmUSD. 

Stripe’s recent $1.1 billion acquisition of stablecoin platform Bridge further reflects its commitment to blockchain-based payments.

Despite the optimism, MetaMask and Stripe face stiff competition from Tether (USDT) and Circle’s USDC, which dominate the stablecoin market. Additionally, users will need compelling reasons to switch from established alternatives.

While a governance proposal has outlined mmUSD’s framework, key details, like launch timing, reserve mechanisms, and cross-chain availability, are still under wraps. 

If successful, the stablecoin could boost Ethereum’s transaction volume and even expand to other chains like Solana, where Stripe already supports crypto payments.

New Wave of Stablecoins Following GENIUS Act’s Approval 

The financial world is undergoing a huge transformation as major banks and corporations race to launch stablecoins following the passage of the GENIUS Act, which established the first comprehensive U.S. regulatory framework for dollar-pegged digital assets.

The legislation’s strict requirements, including 1:1 reserve backing with the U.S. Treasuries, monthly audits, and robust anti-money laundering controls, have given traditional financial institutions the confidence to enter what was once considered crypto’s wild frontier.

Recently, USDe, a yield-generating stablecoin from Ethena Labs, has surpassed FDUSD to claim the spot as the third-largest dollar-backed token, following a 75% market cap increase since mid-July.

Wall Street Goes All-In

Bank of America, Citibank, and JPMorgan are leading the charge, with BofA CEO Brian Moynihan publicly stating the bank is prepared to “hold deposits in stablecoin form” as adoption grows. 

JPMorgan has already deployed JPMD, a deposit token on Coinbase’s Base blockchain that enables 24/7 institutional settlements—a direct challenge to traditional banking hours.

Retail Giants Integrate Crypto Payments

Beyond finance, consumer titans are getting in on the action:

  • Amazon is exploring a stablecoin to streamline checkout and loyalty programs
  • Walmart is reportedly developing a solution for faster supplier payments
  • PayPal has expanded its PYUSD offerings with new yield-bearing features

The GENIUS Act’s dual federal-state oversight and explicit exclusion of stablecoins from securities classification have removed years of regulatory uncertainty. 

Industry analysts note the irony: institutions that once dismissed crypto are now battling to control what could become a $2 trillion market, reshaping global payments, according to the latest report.

As one fintech executive said: “This isn’t about embracing crypto—it’s about surviving the future of money.” With the rules now clear, the race to dominate the stablecoin era has officially begun.

Ethena Targets $1 as USDe Rises to Third-Largest Stablecoin

Ethena price
  • The Ethena price correction resonating within the flag pattern could drive a temporary pullback in the near term with potential breakout loading.
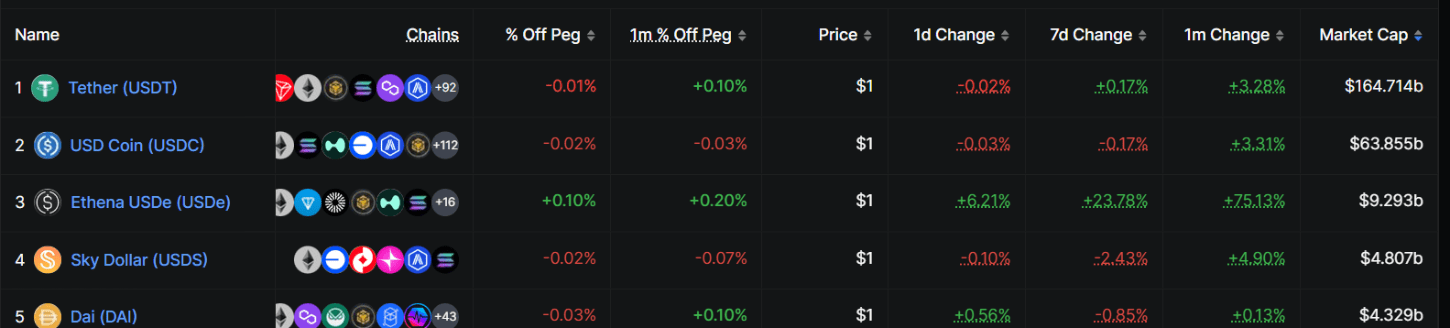
  • Since last month, Ethena’s USDe supply has bounced 75% to reach $9.29 billion, becoming the third-largest stablecoin by market cap.
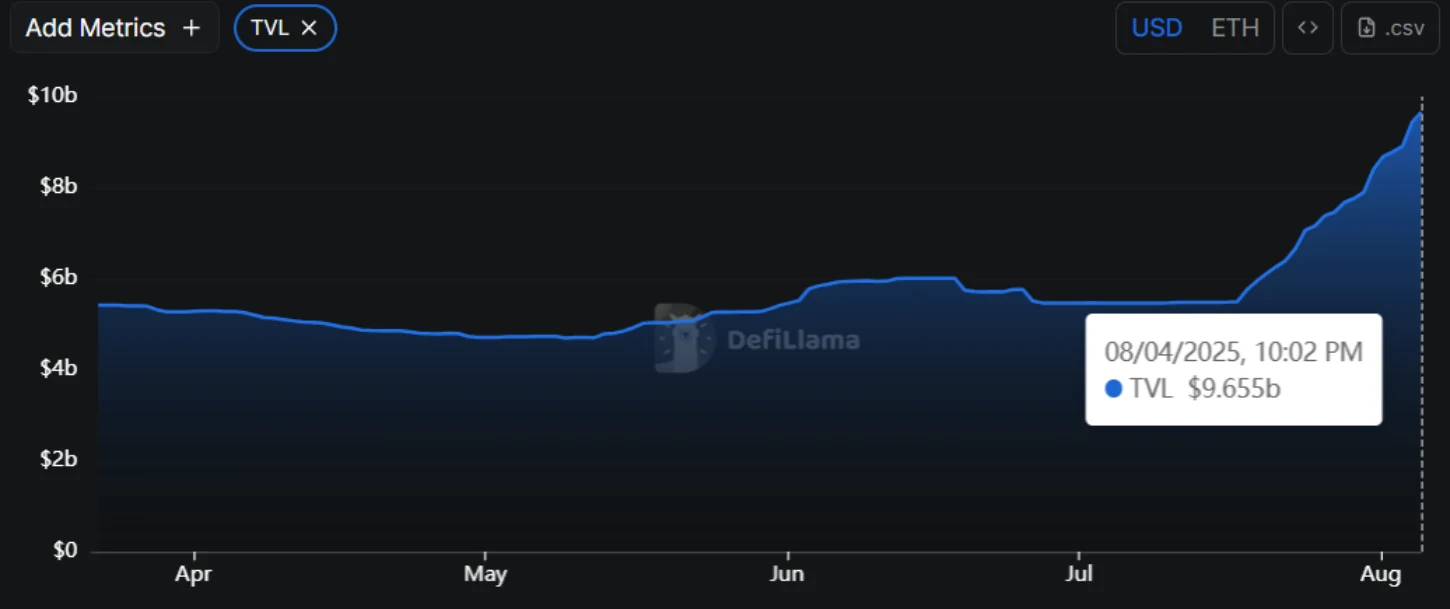
  • Since mid-July, the total volume locked (TVL) on ENA bounced from $5.48 billion to $9.65 billion, accounting for 75% growth.

ENA, the cryptocurrency of the synthetic dollar protocol Ethena, shows a slight uptick of 2.5% on Monday, August 5th. The intraday buying pressure aligns with the broader market relief rally after a significant correction last week. If the upswing manages to overcome the prevailing selling pressure, the enterprise could resume its downtrend and challenge a breakdown below $0.5. However, the on-chain data highlights a significant supply growth in USDe, indicating rising investor confidence in Ethena’s ecosystem and a strong capital inflow. Will fundamental growth push ENA to a $1 rally?

Ethena Price Correction Deepens as On-Chain Data Signals Continued Selling Risk

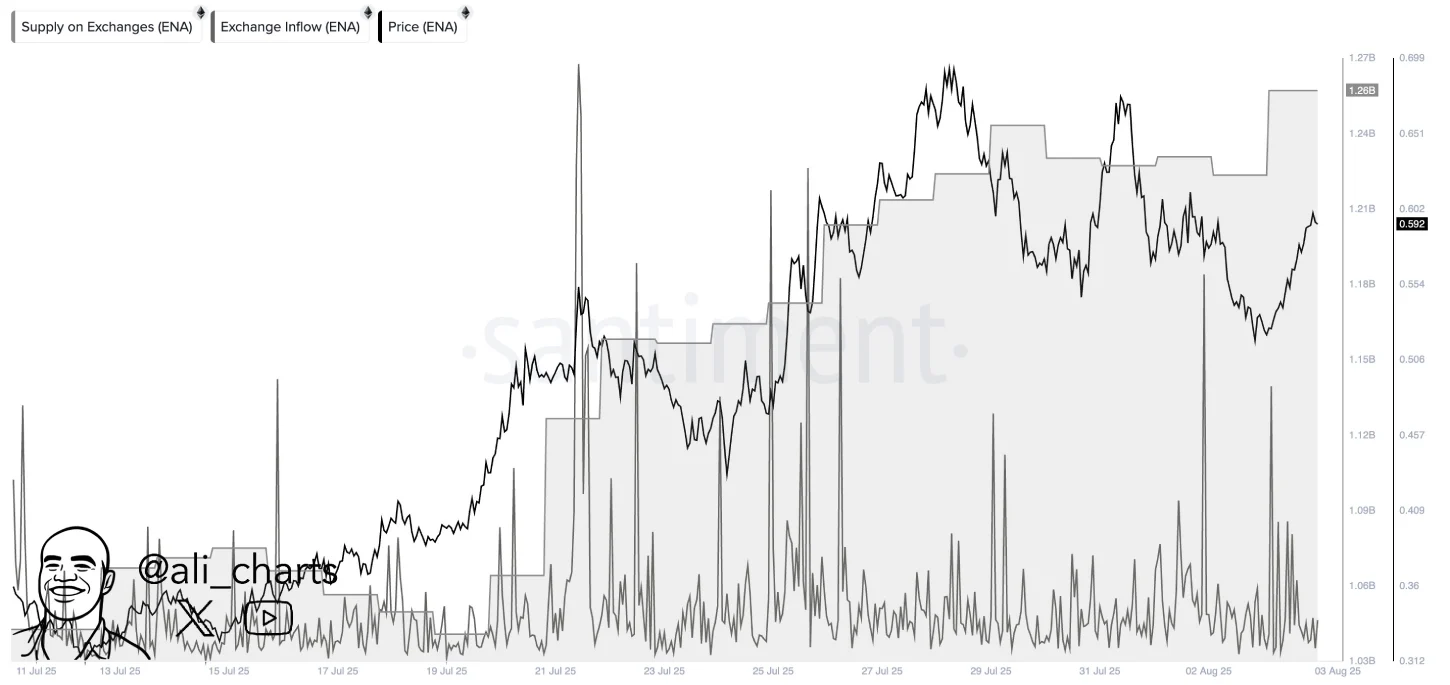
Over the past week, the Ethena price has shown a brief correction from $0.7 to the recent correction low of $0.51, accounting for a 27% loss. While the downswing followed a broader market pullback, the recent on-chain data reveal a notable increase in ENA exchange inflows, signaling the risk of a prolonged correction.

In a recent tweet, market analyst Ali Martinez highlighted that over 250 million ETH has been sent to exchanges in the last two weeks. A surge in ENA transfer to exchange implies rising selling pressure as investors may be preparing to offload holdings amid the market uncertainty.

ENA Exchange Inflow | Santiment

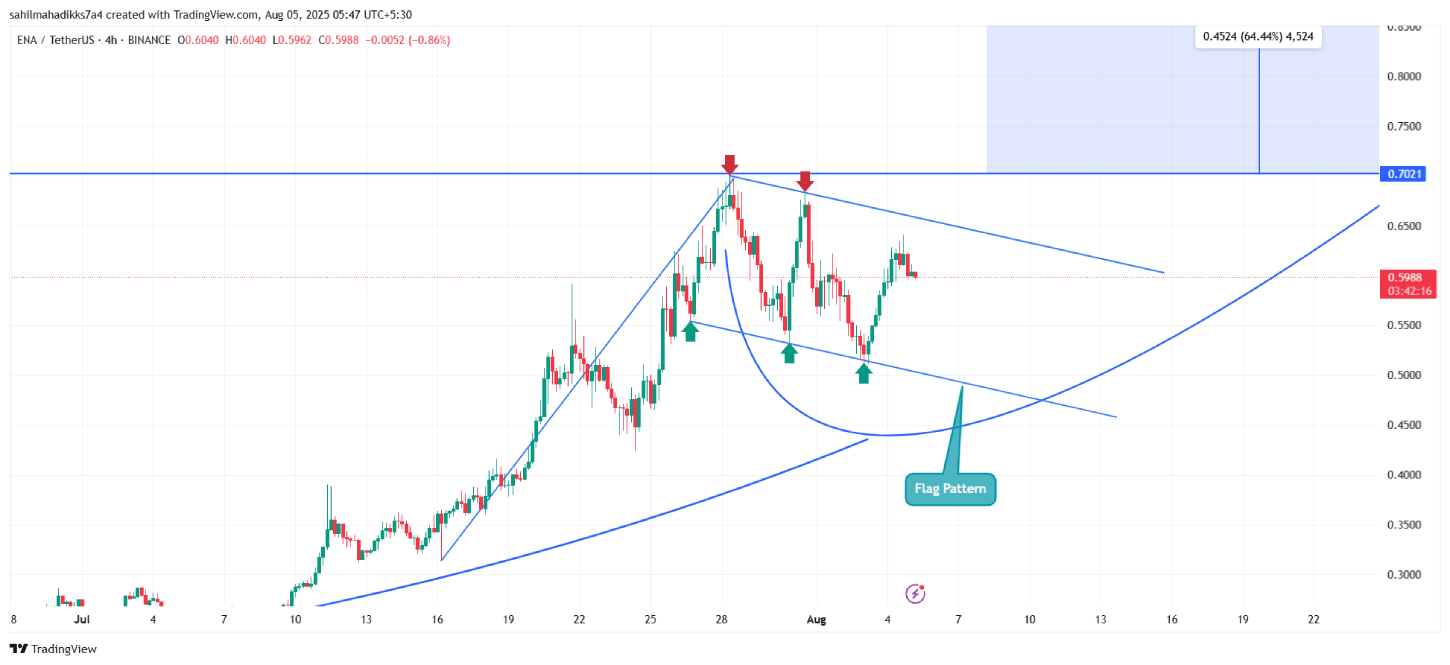
The four-hour chart analysis of ENA price shows the current correction resonating within the formation of a bull-flag pattern. The chart setup is characterized by a long ascending pole reflecting the dominating trend in the market, followed by a temporary pullback within two downsloping parallel trendlines.

Currently trading at $0.6, the coin price is just 6.8% short of challenging the flag’s resistance at $0.64. A potential breakout from this resistance will accelerate the buying pressure and push ENA to a $0.7 rally.

However, if the supply pressure at the dynamic resistance persists, the coin price will drive another bearish swing within the pattern and challenge a bearish move below the $0.5 psychological support.

Also Read: Bitcoin Demand Remains Resilient Amid Price Volatility; $125K BTC Soon?

ENA Poised For Breakout From Cup And Handle Pattern 

Despite the anticipated price correction, Ethena’s synthetic dollar stablecoin, USDe, has recorded a staggering 75% surge in supply over the past month, according to DeFiLlama data. The supply has now reached $9.29 billion, pushing USDe above Sky Follow (USDS) to become the third-largest stablecoin by market cap.

USDe Market Cap

Simultaneously, Ethena has been steadily climbing the DeFi ladder to become the sixth-largest protocol by total volume locked (TVL), accentuating the growing user confidence and capital influx into the platform. 

The sharp rise in supply and TVL indicates a substantial capital rotation among Ethena’s ecosystem, with yield-hungry DeFi natives and risk-conscious stakers being drawn to the protocol. 

Ethena total volume locked (TVL) | DefiLlama

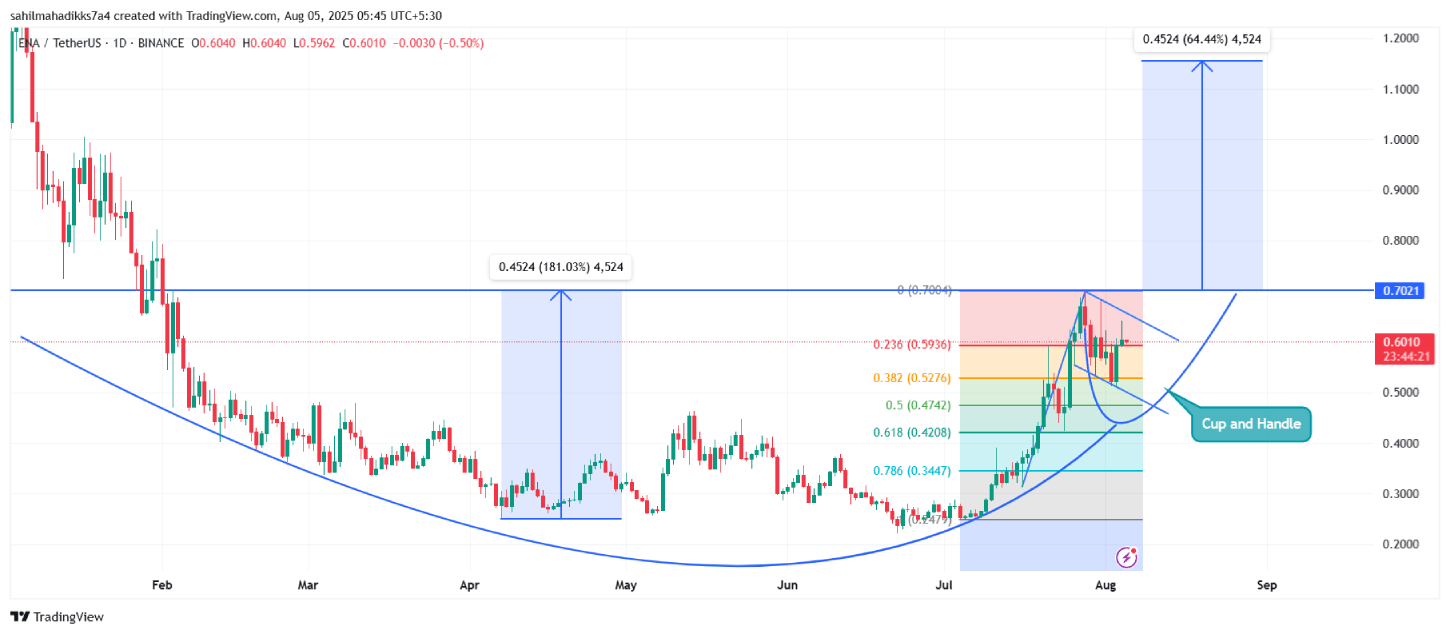
The daily chart analysis of ENA price shows that the recent pullbacks within flag patterns could bolster buyers to complete a cup-and-handle reversal pattern. The chart setup is characterized by a long-accumulation trend with a U-shaped recovery followed by a temporary pullback to recuperate the exhausted bullish momentum.

Ethena Price
ENA/USDT -1d Chart

Thus, a potential breakout from the $0.7 neckline will signal a major change in market dynamics. The post-breakout rally could push the price over 64% to hit the initial target of $1.15.

Also Read: CFTC Introduces Spot Crypto Trading Under Federal Oversight