

On Tuesday, August 18, the USD/CAD showed a narrow spike of 0.01% to reach an exchange rate of 1.387. This resulted in a neutral candle formation in the pair’s daily timeframe chart, accentuating the increasing market uncertainty ahead of the US-Canada tariff deadline. In addition, Canada’s PPI and retail-sales data are scheduled for later this week, which could impact the Bank of Canada’s discussion on an interest rate hike. Exchange-rate movements in USD/CAD since the early part of July have shown sensitivity to these developments.
Bilateral Tariff Discussions
Canada and the United States are still negotiating to resolve trade disputes before the August 19 deadline. On July 20, the United States announced it would apply tariffs of 50% on approximately $20 billion of Canadian imports, but delayed implementation for 30 days so that negotiations could be carried out. The immediate sticking points include autos, steel, dairy, and other bilateral trade irritants, with talks still ongoing and renewed escalation remaining a clear near-term risk.
History shows that a negative conclusion to trade talks has tended to spark upward pressure on the currency pair.
Economic Surprise Trends
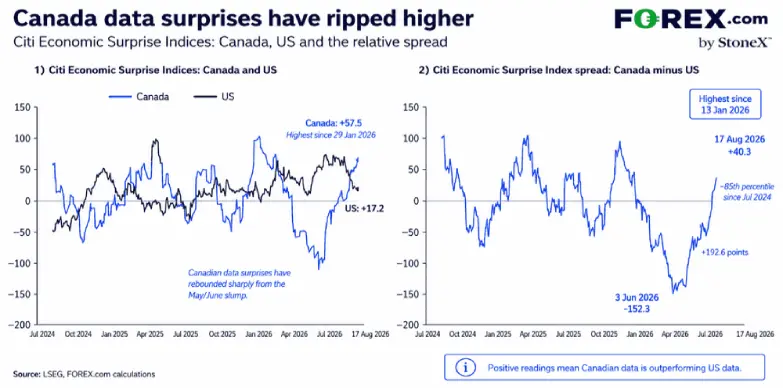
Economic data performance has turned in favor of Canada relative to the United States. Citi’s Economic Surprise Indexes for the U.S. over the last two years have shown a more pronounced decline in positive surprises in the most recent month. Conversely, Canadian readings moved from deeply negative to strongly positive territory over the previous two months. Positive numbers on the spread indicate that Canadian data have been better than U.S. data versus expectations.
The divergence has helped cement expectations that the Bank of Canada will continue to hike rates by a further 25 basis points by the end of the year, despite core inflation staying close to target. On the other hand, the weak data from the United States has compelled a big dovish swing in Federal Reserve expectations. According to federal funds futures, implied Fed tightening for the remainder of the year has collapsed to just 21 basis points, down from over 43 basis points at the end of July.
Price Data and Policy Settings
Canada’s July consumer-price report showed a 0.5% monthly advance in the headline index, raising the annual rate to 3.0%—two-tenths higher than June and one-tenth above consensus estimates. The average of the Bank of Canada’s median and trimmed-mean core measures rose from 1.9% to 1.95%, staying close to the 2% target and marginally above the 1.85% market forecast. The Bank of Canada’s July projections forecast core inflation to remain at or near 2% through the end of 2028.
Scheduled Indicators
Canadian producer-price data is scheduled for release this Thursday, followed by retail-sales data on Friday. In the United States, the market focus is on the minutes of the July Federal Open Market Committee (FOMC) meeting. The minutes will reveal how broadly committee members agreed following a series of milder U.S. data points; notably, three regional Fed presidents voted for a rate increase at the meeting.
USD/CAD Pair Losses 200-day EMA slope
From an early July high of 1.423, the USD/CAD pair has dropped nearly 2.58% to hit the current exchange rate of 1.387. The 30-day negotiation period and Canada’s strong economic data likely strengthened its currency’s position against the dollar.
The technical chart shows that the current downswing in the USD/CAD pair has breached the 200-day exponential moving average. A previous breakdown below this moving average— if sustained— has bolstered further downside in this pair.
If history repeats and the trade deal with the U.S results in favour of Canada, the USD/CAD pair would further slide down to 1.376 or 1.37.
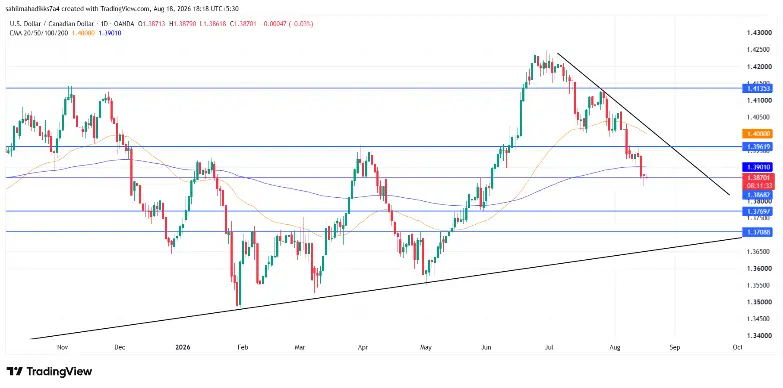
The Relative Strength Index dropped to 28, accentuating the aggressive downward pressure on this pair.