- A sharp decline in SUI futures open interest (OI) reflects the waning investors amid market uncertainty
- A bull flag pattern drives the current correction trend in SUI price.
- The $3.14 floor, currently coinciding with the 200-day EMA, provides a high area of interest (AOI) for traders.
The SUI price shows a 5.1% decline during Tuesday’s market hours to currently trade at $3.45. The selling pressure aligns with Bitcoin’s pullback below $115,000 amid the macroeconomic development in the U.S. market. However, the SUI coin faces additional bearish momentum amid ‘sell-the-news’ market sentiment following the Robinhood listing and the declining trend in future open interest. Will the correction trend push this altcoin below the $3 floor?
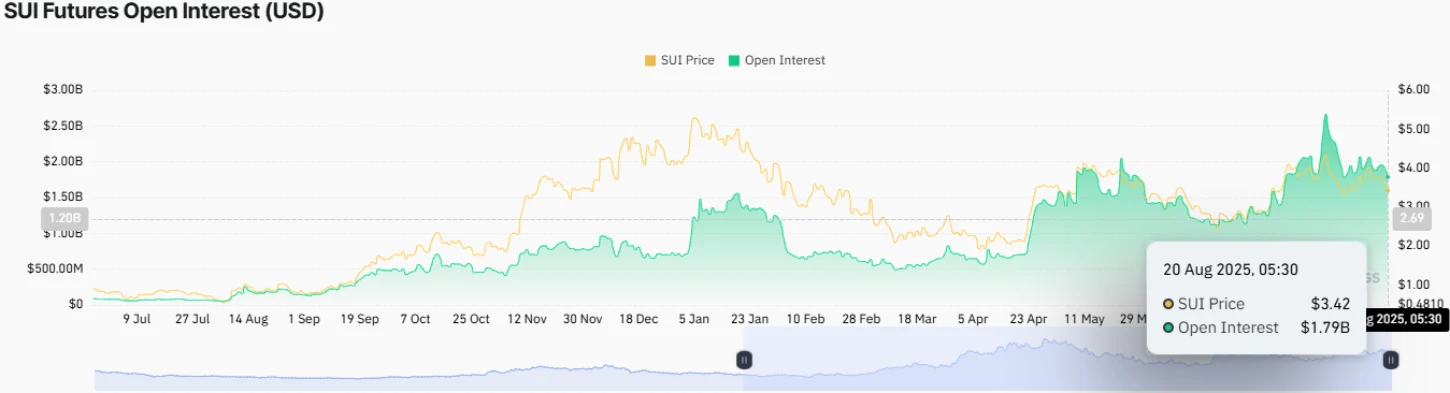
Derivatives Activity Drops as SUI OI Contracts to $1.79B
Over the past three weeks, the SUI price shows a notable correction from $4.44 to the current trading value of $3.43, projecting a 23.16% loss. Subsequently, the asset market cap has dived to $12.13 billion. The bearish momentum deepened during Tuesday’s market hours as traders engaged in profit-taking following the short-lived boost from its Robinhood listing.
Amid the price pullback, the SUI futures open interest (OI) has also plunged from $2.66 billion to $1.79 billion, accounting for a 32% fall. The contraction in OI reflects a sharp decline in speculative activity as traders close their open positions in the market to brace for significant volatility.
Historically, such a sharp drop in OI value suggests a cooling speculative phase for buyers to regain exhausted bullish momentum.
Simultaneously, the total volume locked (TVL) on the SUI network also declined from $2.13 to $2, showcasing a 6.13% loss. This drop in TVL indicates that investors are gradually pulling liquidity out of SUI’s DeFi ecosystem.
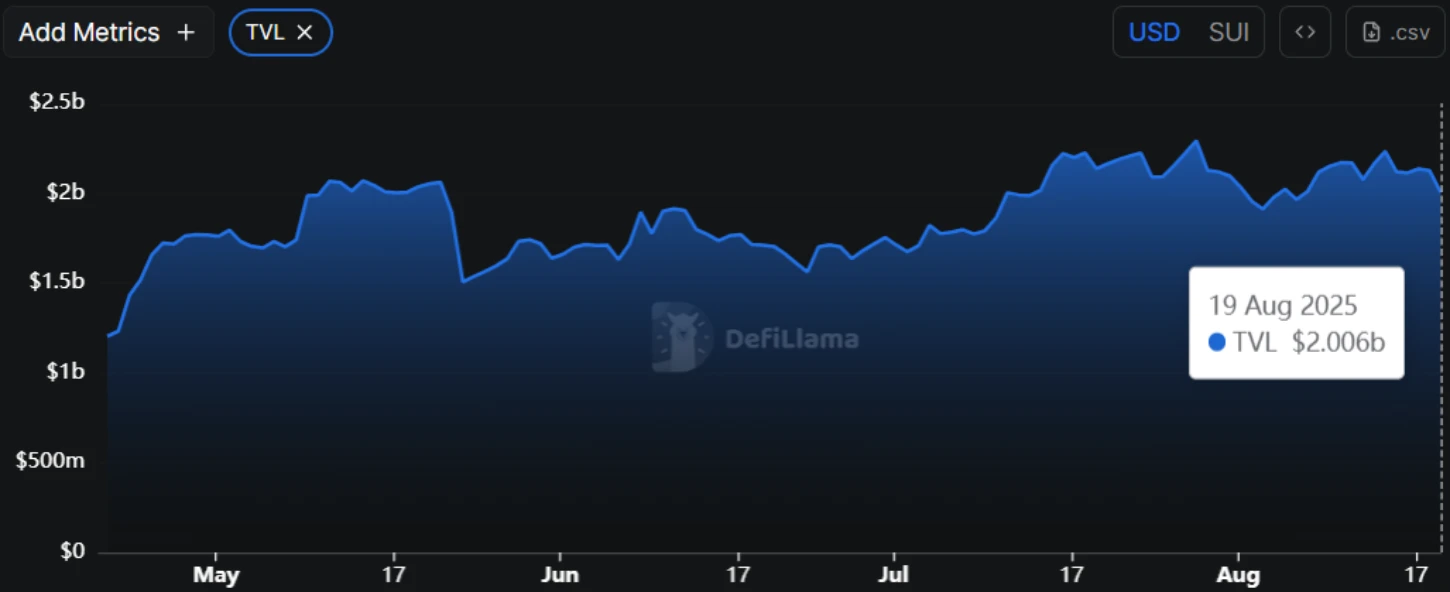
A sustained weakness in TVL could weigh on SUI’s growth outlook. If the trend resumes, the coin price could face additional pressure and drive a prolonged downfall.
Also Read: Chainlink Price Defies Market Pullback With Whale Confidence; $30 Leap Next?
SUI Price for Major Support Test With Flag Formation
The SUI price analysis of the daily time frame chart shows the current correction trend is resonating within the bull flag formation. The chart setup is characterized by a long ascending trendline, reflecting the dominant trend in price, followed by two converging trends to drive a brief correction to recuperate bullish momentum.
The flag pattern is commonly spotted within an established uptrend, as it allows buyers to recoup the exhausted bullish momentum before the next leap. The coin price bounces at least twice from the pattern’s two trendlines and validates its credibility to influence future trend movements.
Currently trading at the $3.44 mark, the SUI price is just 5.5% away from challenging the pattern’s bottom trendline at $3.14. With the broader market correction and declining trend in the future market, the sellers strengthened their grip over this asset. A bearish breakdown below the support trendline will accelerate the selling pressure and drive a prolonged correction of over 11% to hit $2.83 support, followed by a plunge to the $2.64 floor.
The $3.14 mark currently aligns with the 200-day Exponential Moving Average (EMA), establishing a key pivot level for this asset. If the buyers manage to hold this support, the bullish flag pattern will continue to develop and drive a potential price swing towards the overhead trendline.
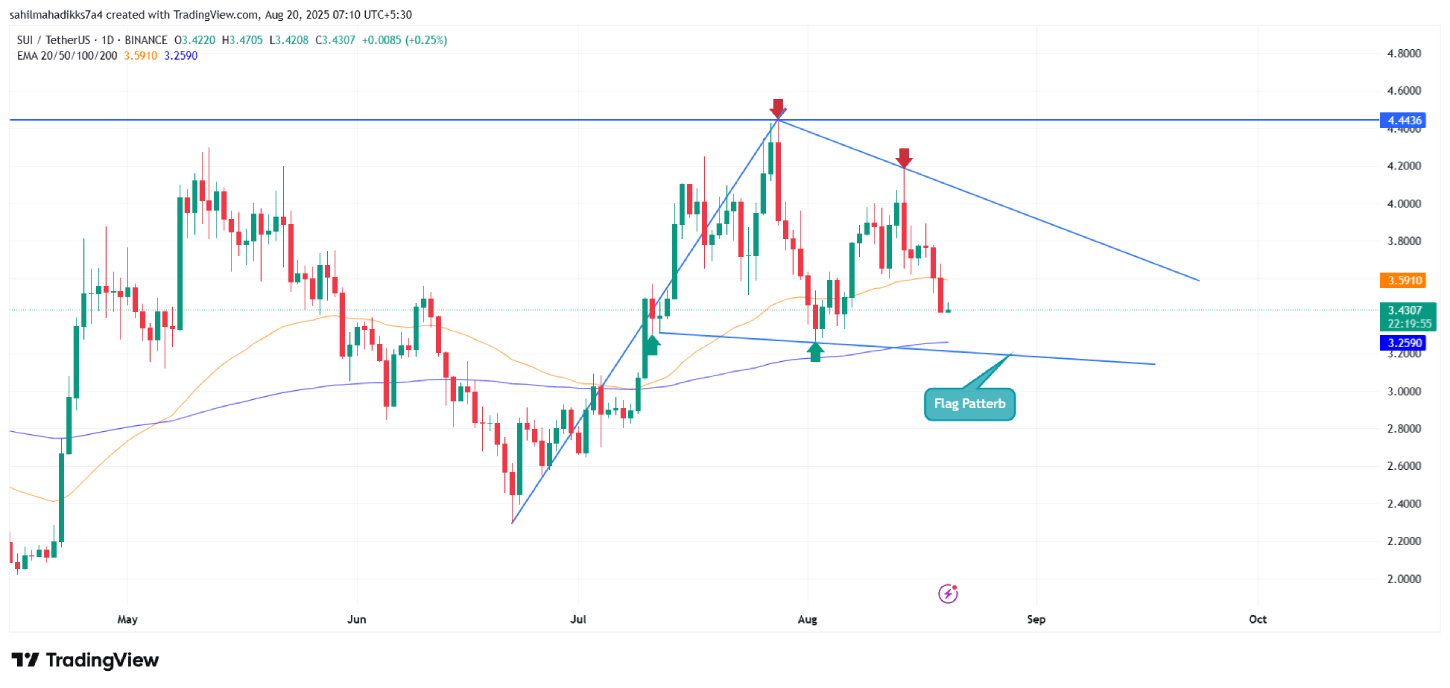
A potential breakout from flag resistance will signal the continuation of prevailing recovery trend and support a bullish surge of over 15% to hit the $4.4 target.
Also Read: Blockchain Lender Figure Technology Files for $400M IPO