- The formation of a bull flag pattern drives the current correction trend in Uniswap price.
- Uniswap’s Long-term holder (LTH) activity shows a sharp surge in active supply, indicating heavy distribution as prices rise.
- Since December 2021, the UNI price has been ranging in a sideways trend within a $12.3 and $4.7 bottom support.
UNI, the native cryptocurrency of the decentralized cryptocurrency exchange Uniswap, plunged over 3% during Thursday’s U.S. market session to trade at 10.3%. The downtick aligns with a bearish momentum in the broader crypto market as investors scale back expectations of a Federal Reserve rate cut in September. However, the selling pressure mounts for the Uniswap price as long-term holders are actively distributing at a key resistance level. Is a breakdown below $9 a close, or do buyers have opportunities to counterattack?
Heavy LTH Distribution Raises Risk of Prolonged Downtrend in UNI
Over the past week, the Uniswap price has shown a V-top reversal from $12.3 to the current trading value of $10.28, registering a 16.4% loss. Subsequently, the asset market cap plunged to $6.47 billion. A majority of major cryptocurrencies, including Bitcoin, faced a similar pullback as investors’ hopes for a September rate cut plummet.
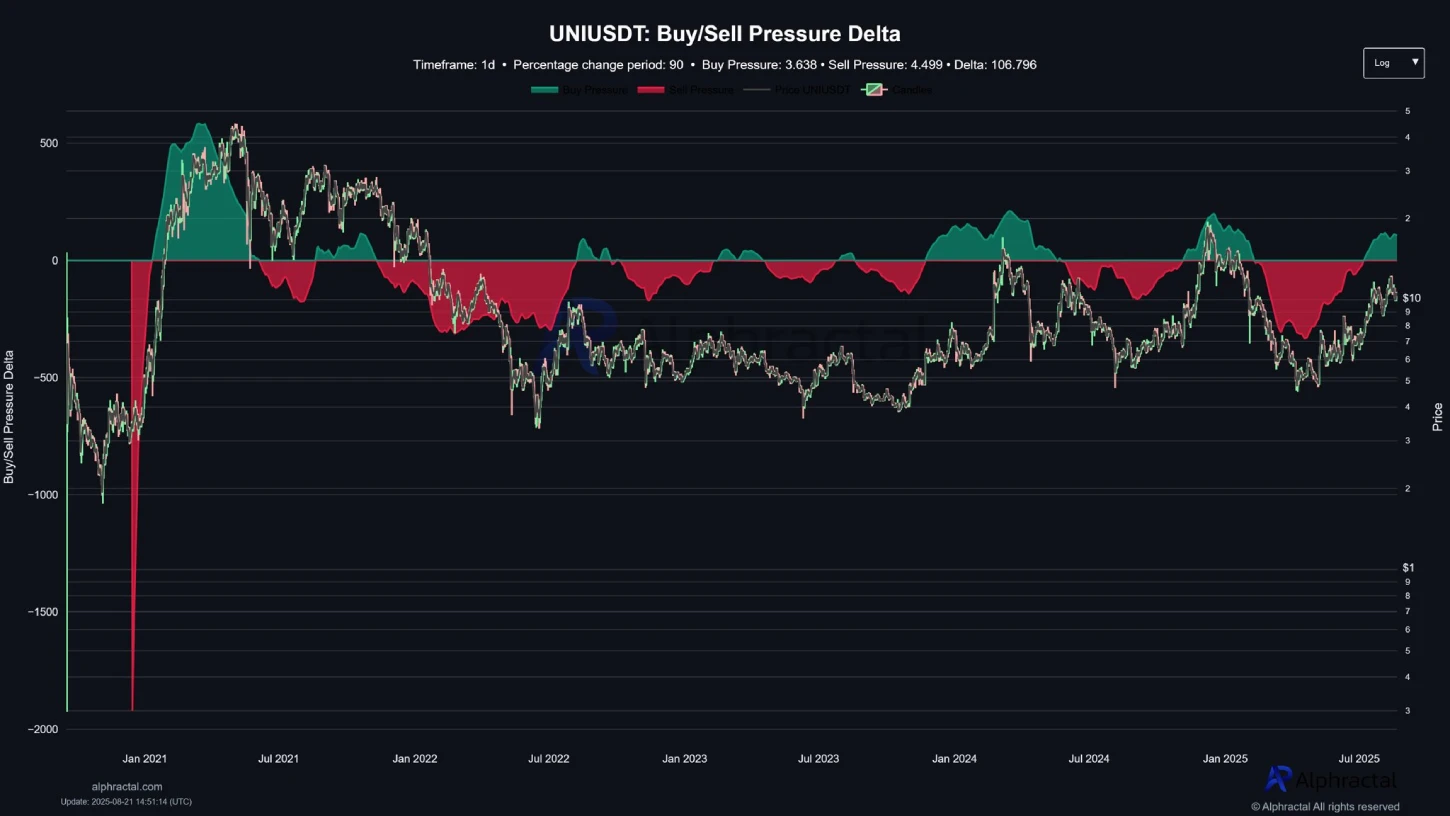
Adding to the bearish note, market analyst Boris highlights why the Uniswap coin struggles to maintain an upward momentum. Since December 2021, the altcoin has traded sideways, creating heavy liquidity positions on either side. The chart below shows a significant short liquidation cluster at $13.5 and a long liquidation zone near $8, creating a key pivot level for traders.
Along with recent market recovery, the Uniswap price recorded a surge in demand pressure, bolstering the asset’s potential breakout. However, the on-chain flow suggests that large players are likely unloading positions through limit orders, creating a strong resistance near recent peaks.
The shared analysis highlights a notable surge in long-term holders’ active supply, signalling a heavy distribution trend as prices surge higher. This sell-the-bounce sentiment is common in an uptrend, signalling a risk for prolonged downfall.
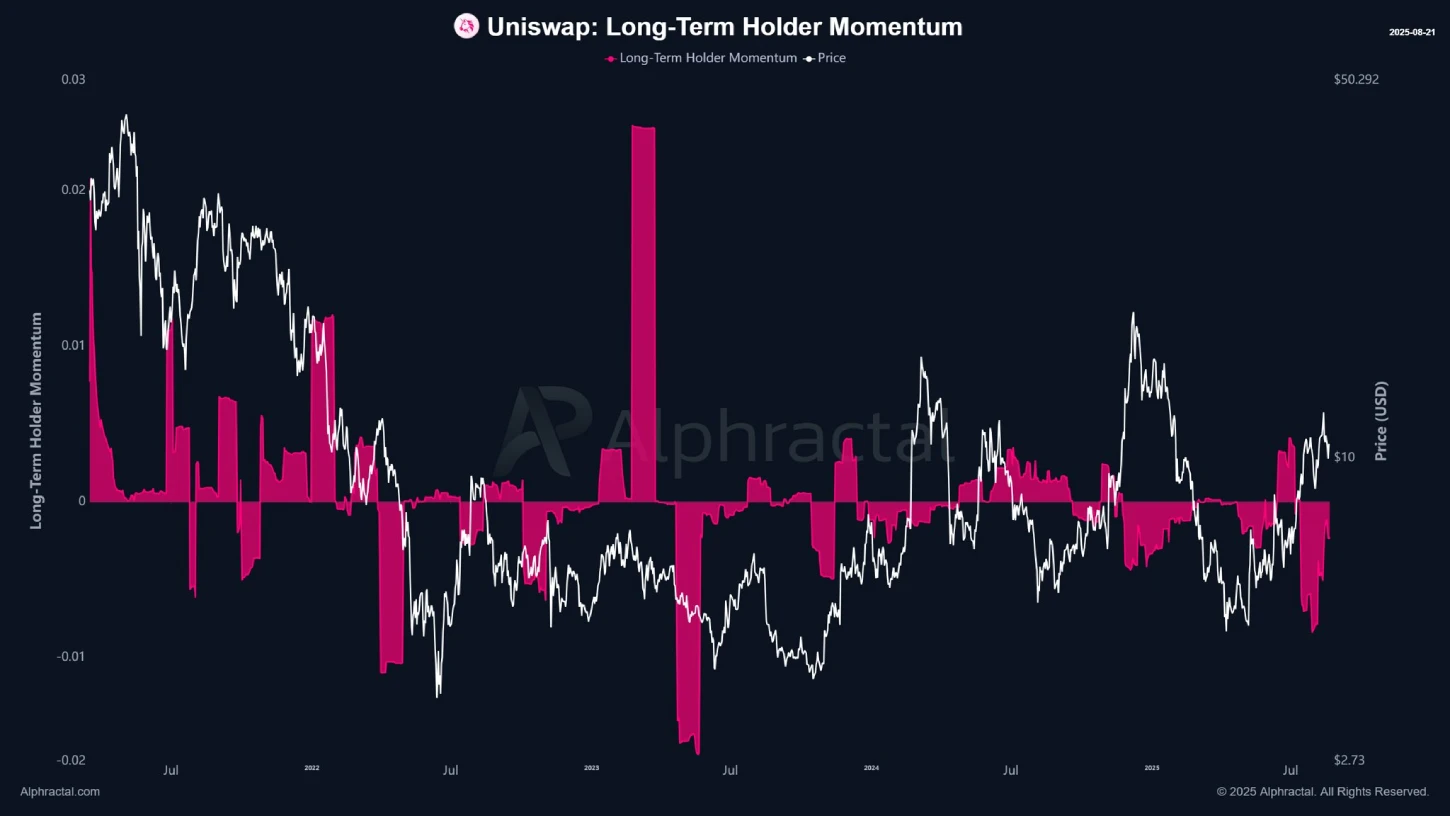
Meanwhile, the short-term holders (STH) activity shows that investors re-entered near the local top, marking a short-term peak. The market is now entering a stress test for STHs, with a correction likely as speculative positions unwind.
If this trend continues, the Uniswap price could struggle to hold its position above the $10 floor.
Uniswap Price Eyes Major Breakout Within Flag Pattern
The 4-hour chart analysis of Unicoin Price shows its current correction trend is strictly resonating within converging trendlines of a bull-flag pattern. The coin price bounced at least three times from the pattern’s resistance trendline and four times from the bottom trendline to create its strong influence on the price trajectory.
The chart setup is characterized by a long ascending trendline called ‘Pole” denoting the dominating trend in price, followed by a temporary correction within the converging trendlines to recuperate the existing bullish momentum.
The coin price is positioned above the 100-and 200-day exponential moving average (EMA), indicating a broader trend in bullishness. Despite the intraday sell-off, the UNI coin price is less than 1% short of a bullish breakout from the overhead trendline
Thus, a potential breakout will accelerate the buying pressure in price and set a potential surge towards $12.3 resistance, signaling a nearly 20% growth.
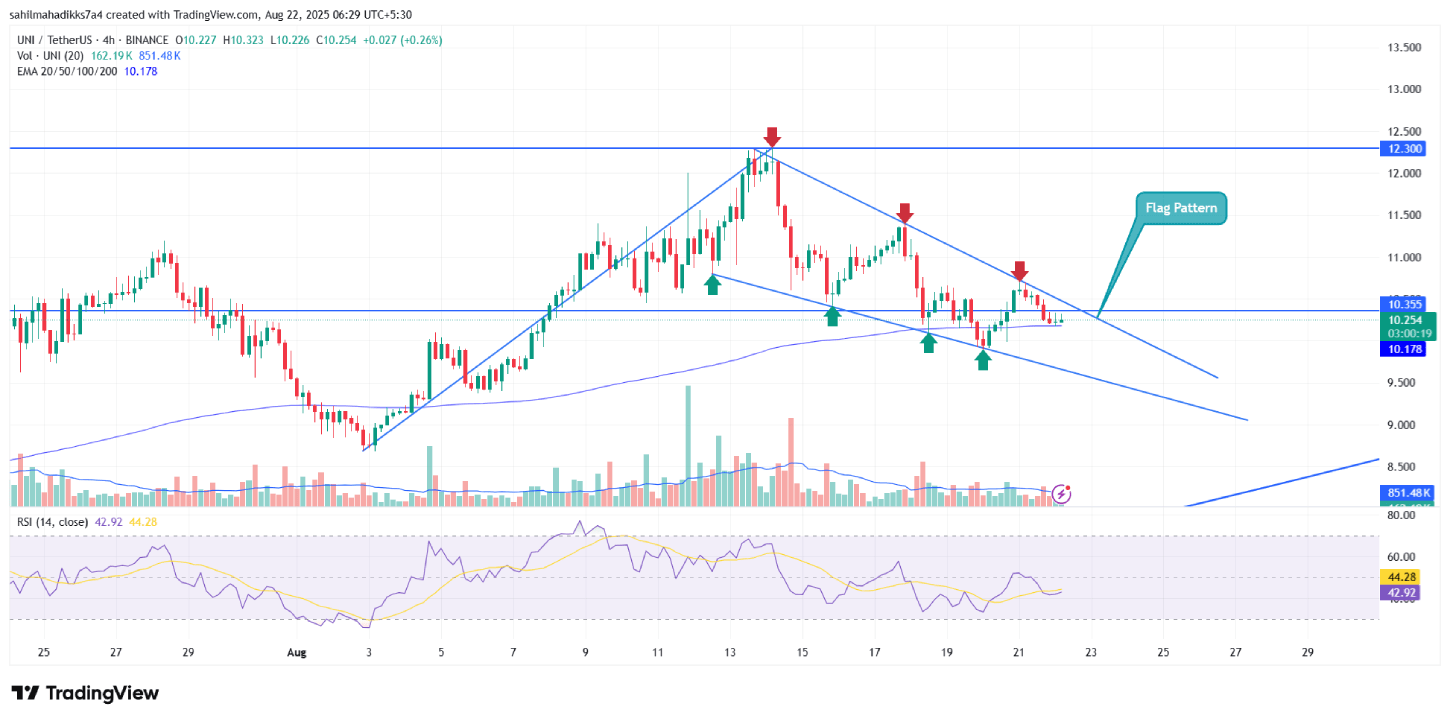
However, if the market selling pressure persists, the coin price could face another reversal within the flag formation and drive a prolonged down towards $9.5 floor.
Also Read: Will Solana Price Break Lower by August End?