
- The XRP price call to the 50% retracement level signals a healthy pullback for buyers to regain bullish momentum
- The flag pattern formation in the daily chart accentuates a temporary pullback before a potential breakout.
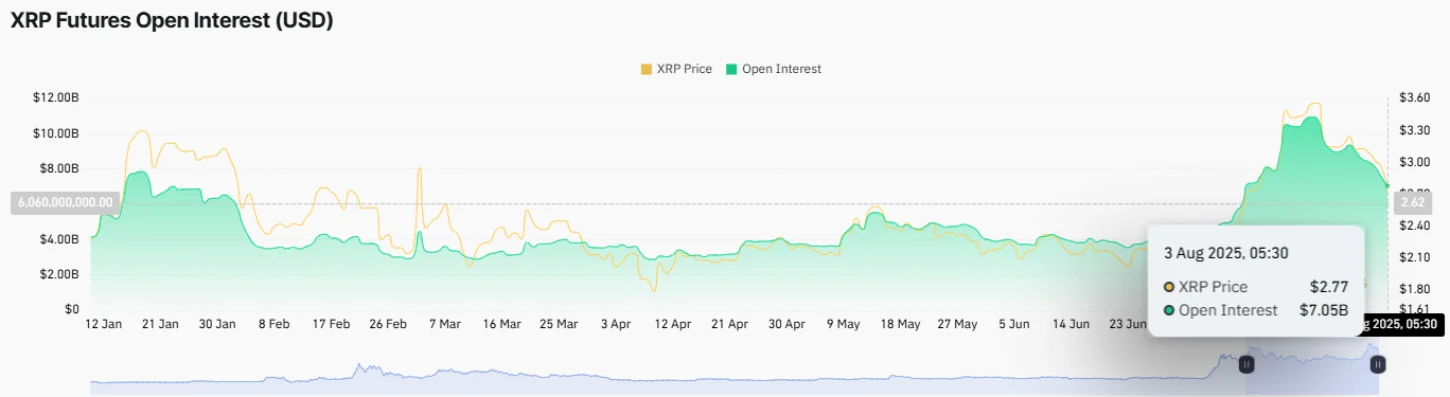
- The declining trend in XRP’s open interest and an anticipated dive of the funding rate into the negative region indicate a weakening bullish momentum.
On August 3rd, the XRP price witnessed a notable rebound of +5.4% to reach a $2.9 trading value. The buying came as a relief rally in the broader market, as a majority of major assets showed a sudden uptick after a sharp sell-off. While the Ripple crypto follows a similar momentum, the declining trend in derivative market data signals a risk of prolonged correction. Will this correction extend below $3, or will buyers have an opportunity to counterattack?
XRP’s Derivative Metrics Turn Bearish:
In the past two weeks, the XRP price witnessed a significant correction from $3.65 to a $2.7 low, registering a 25% loss. The selling pressure follows a post-rally correction sentiment in the market, indicating a cool-off period for buyers to regain bullish momentum.
However, the derivative market decline recorded a notable drop, along with price signalling a cautionary action from traders amid market uncertainty.
According to Coinglass data, XRP futures open interest has dropped from $10.94 billion to $7.05 billion, projecting a 35.6% drop. This significant decline in OI suggests mass liquidation or unwinding of positions in the futures market. This cooling of speculative interest could act as a precursor to a continued correction trend unless strong buying pressure returns.
In addition, the XRP OI-weighted funding rate has started to shrink near neutral travel. Though the intraday gain has pushed the metric to 0.0051%, if the broader market correction persists, the XRP’s funding rate could turn negative.
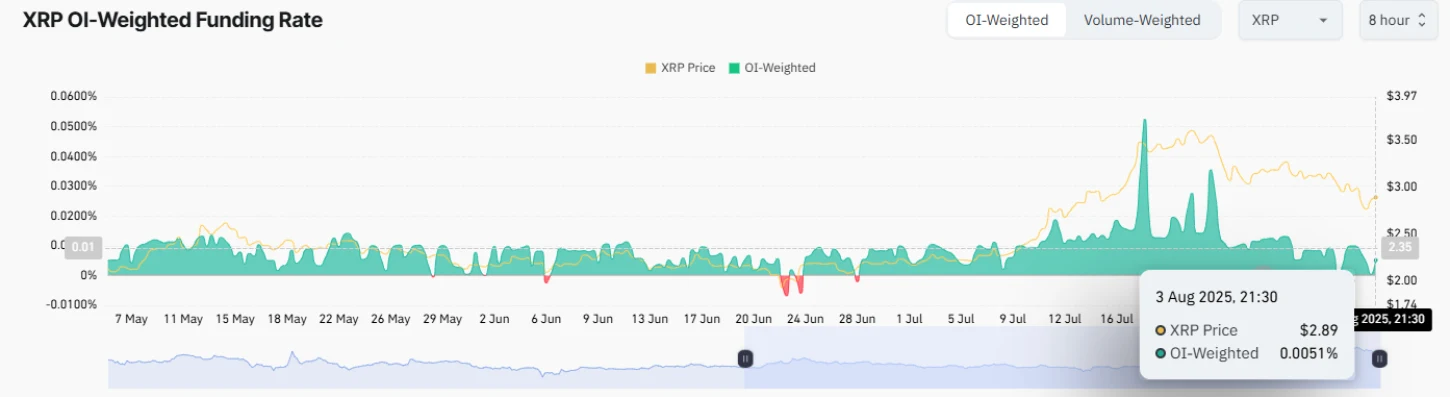
If materialized, this negative metric should indicate that short sellers are paying a premium to longs for holding their position, accentuating their confidence for a potential fall. As the majority of players are betting on further price decline, the current bearish momentum accelerates the prolonged downward drive.
Thus, until these metrics show a sharp upswing to signal the revival of prevailing market recovery, the Ripple crypto could decline further.
XRP Price Drives Current Correction Within Flag Pattern
The four-hour chart analysis of the XRP price shows the recent correction resonated within two downsloping trendlines, revealing the formation of a bull flag pattern. The chart setup is characterized by a long ascending pole, which denotes the dominating trend in the market, followed by a temporary pullback to regain the bullish momentum.
The chart setup is commonly spotted in the middle of an established uptrend to stabilize the price before the next leap. In addition, the pullback is backed by a declining trend in trading volume, further accentuating the weak conviction from sellers to sustain lower prices.
With an intraday gain of 5%, the XRP price tried to sustain above the 50% Fibonacci retracement level. Historically, the Fibonacci levels of 23.6%, 38.2%, and 50% have offered buyers strong pullback support. As the coin price holds above the daily exponential moving averages of 50, 100, and 200, the long-term trend is bullish.
Currently trading at $2.91, the XRP price is just 1% away from challenging the pattern’s resistance trend near the $3 psychological barrier. A potential breakout above this floor will signal the accelerating bullish momentum and drive a potential rally above the $3.65 high to hit $4.
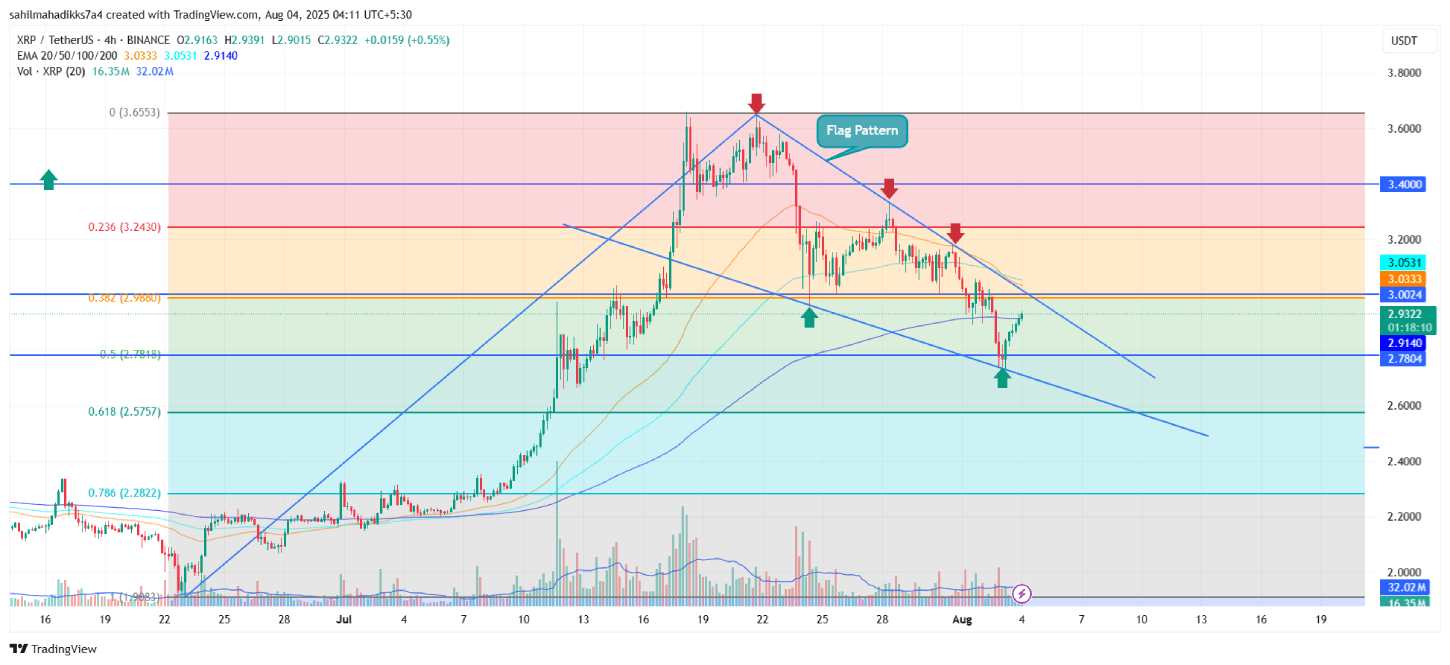
However, with the declining trend in XRP’s future open interest, the anticipated breakout could be delayed and drive another bear cycle within the flag formation.
Also Read: Bitcoin Price Faces $110 Breakdown Amid U.S.-Russia Nuclear Tensions and Fresh Tariffs